
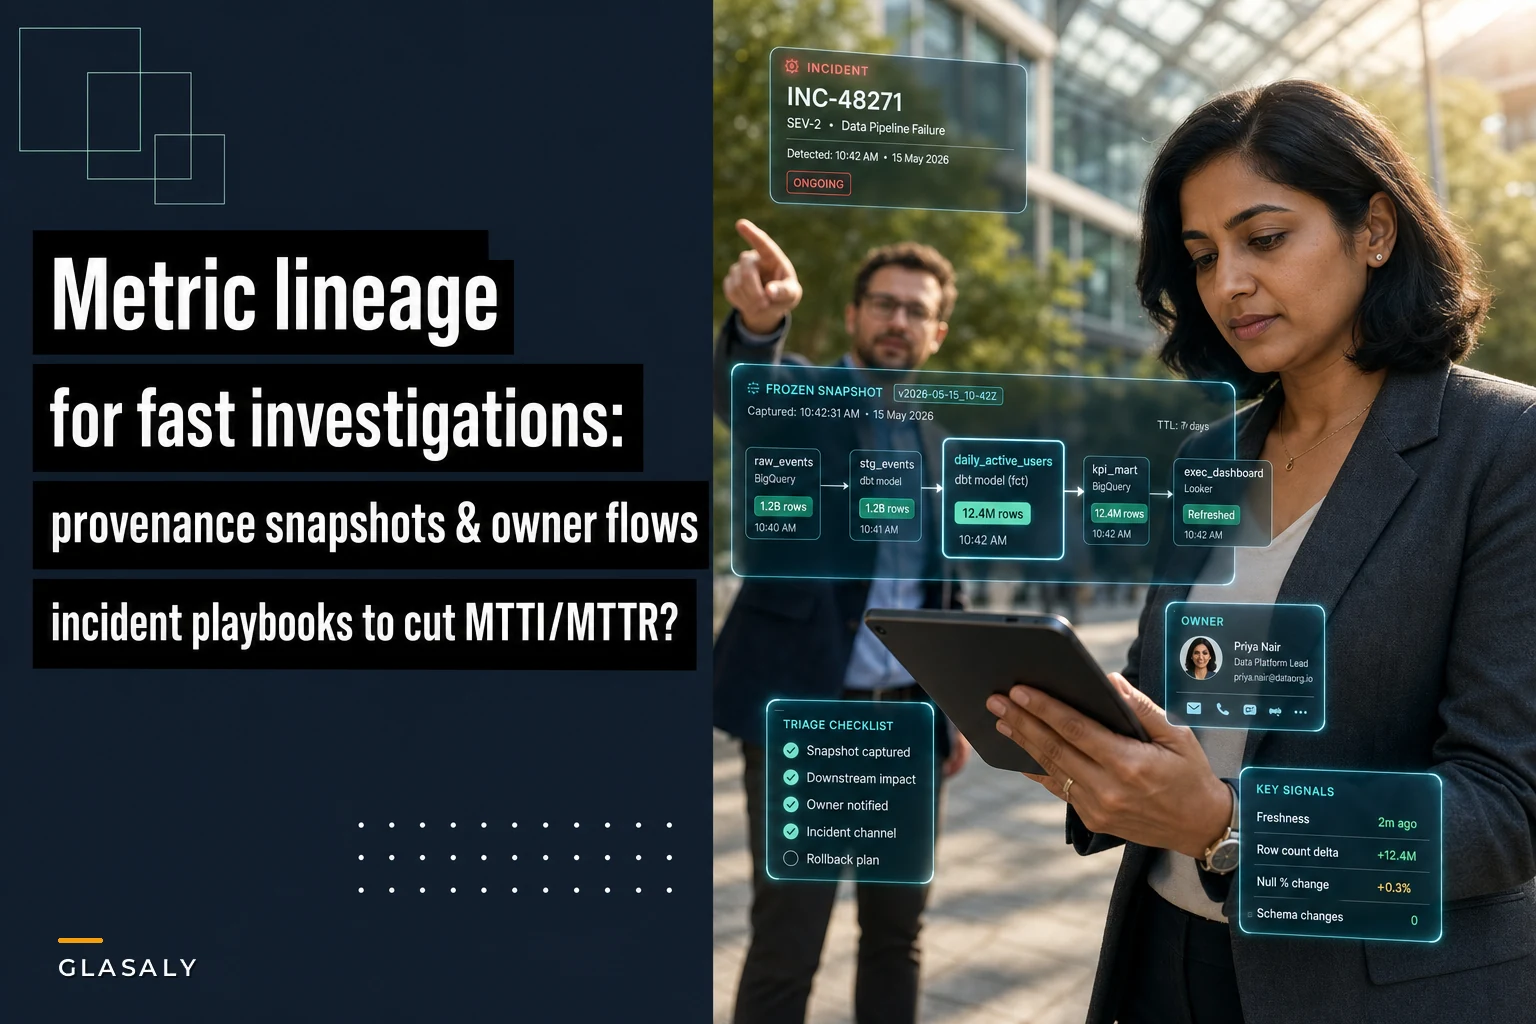

The clock that kills you during a data incident isn't MTTR. It's MTTI — mean time to identify. The gap between "revenue dashboard looks wrong" and "we know exactly which transform broke it" is where most teams bleed hours. And almost always, that gap exists because nobody knows where the number came from.
Why the first 20 minutes of a metric incident decide everything
You've probably lived some version of this. A finance lead pings you at 8:40am: gross margin dropped four points overnight. You open the dashboard, confirm it's real, and then start guessing. Was it the pricing table? The FX conversion job? A late-arriving refund batch? The dashboard tells you what is wrong but nothing about how the number is assembled. So you go spelunking through the warehouse, opening one model file after another, trying to reconstruct the lineage in your head while three people are waiting on Slack.
That reconstruction — done manually, mid-incident, under pressure — is the single biggest waste of time in metric triage. This post is narrowly about fixing that: building a metric lineage incident playbook that surfaces lineage the moment triage starts, freezes a provenance snapshot before things change, routes to the right owner, and gives the investigator a checklist instead of a blank page.
The reconstruction tax nobody budgets for
When lineage isn't at your fingertips during an incident, you start at the metric and work backward by memory. You know netrevenue lives in a marts model. You open it, find it joins to orders, refunds, and fxrates. You check each upstream table's freshness, guessing which one drifted. Meanwhile the underlying data keeps moving — a scheduled job runs at 9:00, a backfill completes at 9:15 — and now the state you're investigating isn't even the state that triggered the alert.
Stop missing critical business insights.
Glasaly helps you create, share, and track interactive dashboards effortlessly.
- Real-time data visualization
- Collaborative report sharing
- Customizable analytics widgets
No credit card required
A typical example: a mid-sized ecommerce ops team gets a margin alert. The on-call analyst spends roughly 35 minutes tracing lineage manually, another 20 confirming which upstream table was stale, and by the time they've isolated it to a delayed fx_rates load, the table has already refreshed. The evidence is gone. They think they found it, but can't prove it, so they spend another half hour reproducing the failure. What should have been a 15-minute identify turned into 90 minutes — most of it rebuilding context the system already had.
Multiply that across a team handling 8–12 metric incidents a month and the reconstruction tax alone eats something like 40–60 analyst-hours monthly. That's not root-cause work. That's just finding where to look.
Lineage belongs in triage, not in a separate tool
Most teams do have lineage somewhere. It's in the catalog, or the transformation tool renders a DAG, or someone maintains a diagram. The problem is that lineage lives in a different context than the incident. During triage you're in the alert, the dashboard, or the incident channel — and to get lineage you have to context-switch into another tool, find the right model, and mentally map it back to the metric you're staring at.
-
Every upstream table and transform that feeds the metric, in order
-
The last successful run time and freshness of each upstream node
-
Which of those nodes changed in the last 24 hours (definition changes, schema changes, unusual row counts)
-
The owner of each node
That last-24-hours highlight is the part people skip, and it's the most valuable. In practice, the culprit is almost never a random node deep in the graph — it's whatever changed recently. A lineage view that quietly flags "these two upstream nodes were modified since yesterday" collapses a ten-node investigation down to two candidates before you've typed a single query.
This is a natural extension of the observability work covered in the SLO framework for metrics and data-quality. SLOs tell you that a metric breached. Lineage-in-triage tells you where to start looking. One without the other leaves half the investigation manual.
Freeze a provenance snapshot before you touch anything
The second failure — the one that quietly wrecks investigations — is that the evidence keeps moving while you investigate.
Warehouses are live. Tables refresh, partitions get overwritten, late data arrives, definitions get patched. If your incident investigation depends on querying the current state, you're chasing a moving target. By the time you've formed a hypothesis, the data that supported it may have been overwritten by the next scheduled run.
The discipline that fixes this is an auto-provenance snapshot: the moment an incident is opened, you capture a frozen record of the metric's context. Not the whole warehouse — just the relevant slice.
-
The metric definition as it existed at alert time (the exact SQL or semantic-layer version)
-
Row counts and freshness timestamps for each upstream node
-
The last N run logs for the jobs feeding those nodes
-
A small sample of the metric's contributing rows (enough to reproduce, not the full table)
-
The dashboard value and filter state that triggered the alert
A quick snapshot workflow looks like this.
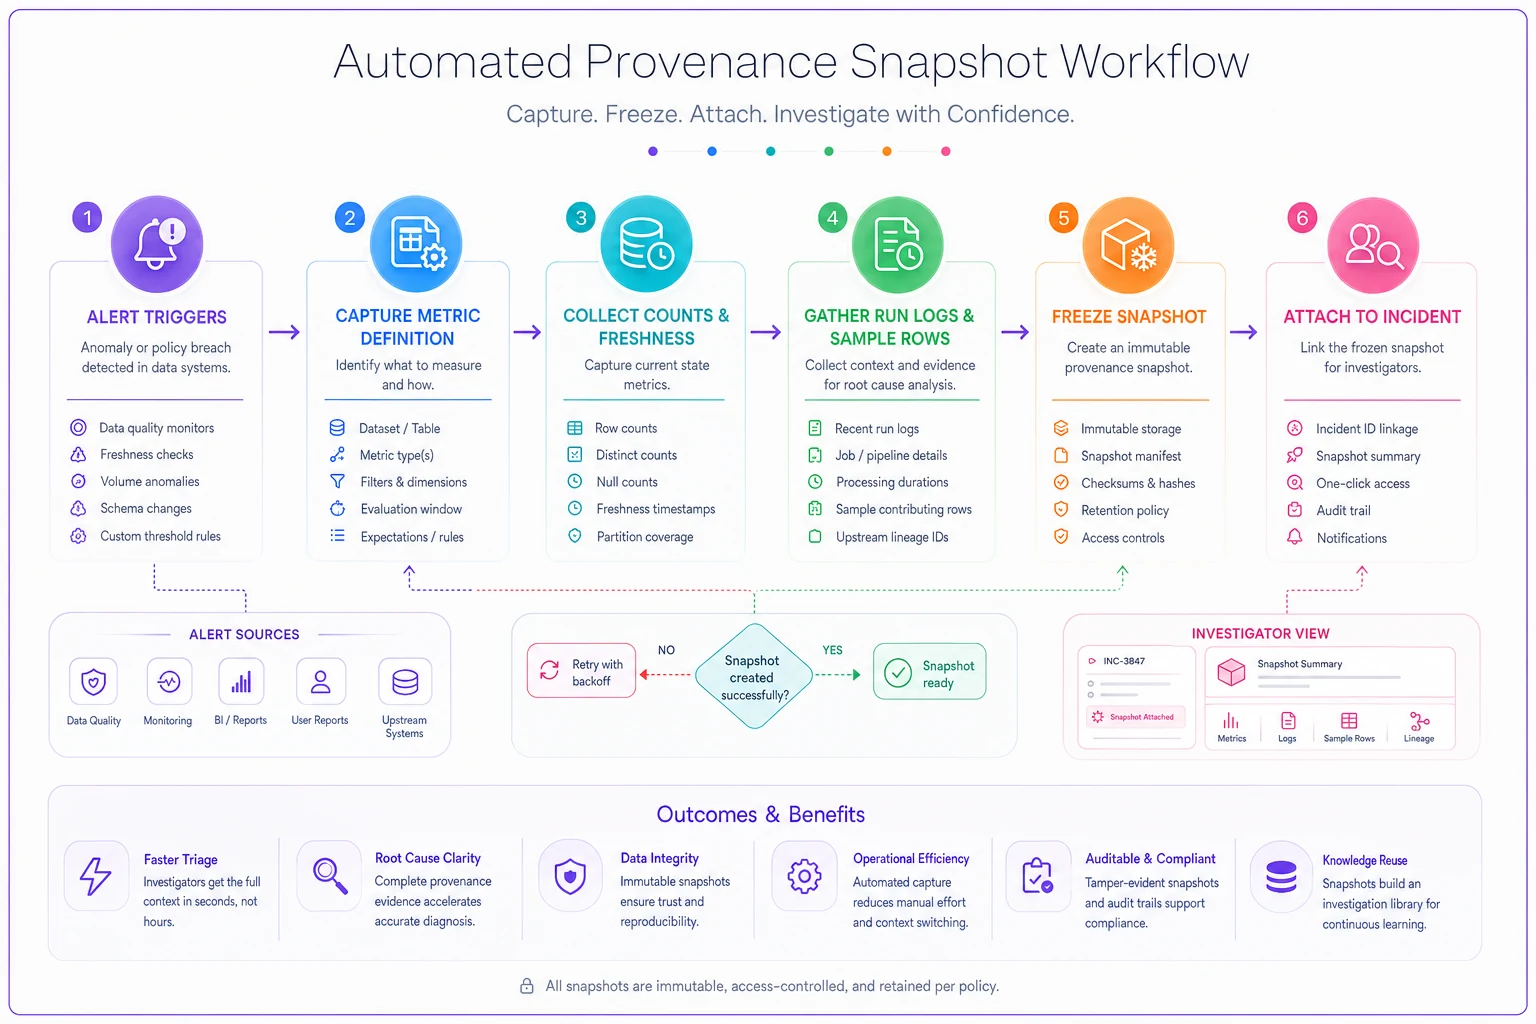
The point isn't archival. Two hours later, when someone asks "are you sure it was the FX job and not a refund batch?", you can answer from the frozen snapshot instead of shrugging because the tables already moved on. Snapshots turn "I think it was X" into "here's the state at 8:41 that proves it was X."
Teams that already run snapshot diffs and deployment gates for dashboards sometimes assume that covers them. It doesn't. Deployment snapshots protect releases. Provenance snapshots protect investigations — they capture the accidental, unplanned state that caused the incident, which no deployment gate ever recorded.
Owner contact flows: stop guessing who to ping
There's a small, unglamorous thing that adds a surprising amount of delay to every incident: figuring out who owns the broken node.
You've traced the incident to a stale fxrates table. Who owns that pipeline? The data engineer who left in March? The finance analyst who set it up two years ago? The vendor integration nobody remembers configuring? In a lot of teams the answer is a Slack message into a general channel — "anyone know who owns fxrates?" — followed by twenty minutes of silence because it's 8am and nobody's online yet.
| Node | Primary owner | Backup | Escalation after | Notify channel |
|---|---|---|---|---|
fx_rates load | Data eng (Priya) | Vendor liaison | 15 min | #data-oncall |
refunds model | Finance analyst | Data eng | 30 min | #finance-data |
net_revenue mart | Analytics team | — | 10 min | #metrics-incidents |
The lineage view shouldn't just show the owner — it should let the investigator trigger the contact flow directly from triage. Identify the stale node, click through to notify the owner with the provenance snapshot already attached. No hunting through a wiki. No cold Slack messages. The owner opens the notification and sees the frozen state, the freshness gap, and the metric impact in one place.
The common mistake is treating ownership as a static spreadsheet. Ownership drifts. People change roles, pipelines get handed off, and the doc rots. If your owner mapping isn't tied to the same governance discipline you use for the metrics themselves, it will be wrong exactly when you need it. This is the same problem addressed in the metric taxonomy governance framework: unowned things become unmaintainable things.
The investigator checklist that replaces the blank page
When a junior analyst catches an incident at 8am, the worst thing you can hand them is an empty query editor and a vague "figure out what's wrong with margin." Experienced investigators have a mental checklist. Newer ones don't, so they flail — and flailing under pressure is how you get wrong conclusions and premature "resolved" tags.
-
Confirm the breach is real against the frozen snapshot, not a rendering or filter artifact
-
Check the highlighted "changed in last 24h" nodes first, in order of proximity to the metric
-
For each changed node
compare current freshness vs expected schedule
-
Check for late-arriving data (refunds, adjustments, backdated entries)
-
Verify no metric definition change landed since the last known-good value
-
Check for schema drift on upstream joins (renamed or nullable columns silently dropping rows)
-
If unresolved after the above, escalate to the node owner with the snapshot attached
Start with the nodes flagged "changed in last 24h" and work outward; they usually contain the culprit.
The ordering matters. It's not "check everything." It's "check the things most likely to be the cause, in the order they're most likely to be the cause." That prioritization is what separates a 15-minute identify from a two-hour one.
The deeper diagnostic sequencing here builds directly on the operational root-cause investigation playbook — the checklist above is the triage-speed front door; the root-cause playbook is the full investigation behind it. Both are worth having. The checklist alone won't get you through a complex multi-node failure, but it will eliminate the 70% of incidents that are simpler than they look.
A real scenario: from 90 minutes to under 25
A subscription analytics team — roughly six analysts supporting a SaaS finance and ops org — was handling around 10 metric incidents a month, mostly on revenue, churn, and MRR metrics. Their MTTI was sitting somewhere near 75–90 minutes per incident, and most of that was pure reconstruction: tracing lineage by hand, then re-querying moving tables to confirm hunches.
They made three narrow changes. First, they wired lineage into the incident channel so every alert arrived with its upstream graph and a "changed in last 24h" flag. Second, they auto-captured a provenance snapshot the moment an incident opened. Third, they attached owner contact flows to the 20 or so most incident-prone nodes.
Nothing exotic. MTTI dropped to somewhere around 20–25 minutes on typical incidents. The biggest single win wasn't even the lineage graph — it was the snapshot. Analysts stopped losing the evidence to the next scheduled run, which meant they stopped re-investigating the same incident twice. A couple of incidents a month that used to spill across the whole morning now closed before the 10am standup.
The margin didn't come from a smarter algorithm. It came from removing the manual reconstruction step and freezing the evidence before it moved.
Where AI-assisted lineage actually helps — and where it doesn't
This is where operational software earns its keep, but it's worth being precise about what that actually means. The valuable automation isn't "AI tells you the root cause." It's the boring, reliable work underneath: continuously parsing your transforms to keep the lineage graph accurate without anyone maintaining it by hand, watching upstream nodes for changes that flag "look here first," and snapshotting provenance automatically the instant an alert fires.
An AI-assisted operational platform is genuinely useful at the pattern-matching layer — surfacing which upstream nodes changed, correlating a freshness gap with a metric breach, drafting the incident summary from the snapshot so the investigator starts with context instead of a blank page. What it should not do is close the loop on its own and mark things resolved. Metric incidents almost always have a business judgment component — was that a real refund spike or a data error? — and that stays with a human.
The right mental model: automation removes the reconstruction tax so analysts spend their time on judgment, not on rebuilding context a machine already had.
When this setup makes sense
-
You're handling more than a handful of metric incidents a month
-
Your warehouse refreshes frequently, so evidence moves during investigations
-
Multiple teams own different pieces of the same metric's lineage
-
Junior analysts catch incidents and need structure, not tribal knowledge
If you're a two-person team with five metrics, don't build this. The reconstruction tax only becomes worth automating once your lineage is too complex to hold in your head and too fast-moving to investigate against live tables.
When it's overkill
-
You have a small, stable metric set with a couple of pipelines you know cold
-
Incidents are rare enough that manual tracing costs less than the setup
-
One person owns everything and is the lineage graph
If you're a two-person team with five metrics, don't build this. The reconstruction tax only becomes worth automating once your lineage is too complex to hold in your head and too fast-moving to investigate against live tables.
Bringing it together
Fast metric investigations aren't about smarter analysts or fancier alerts. They're about eliminating two silent time sinks — reconstructing lineage from memory, and investigating against data that keeps changing underneath you.
Surface lineage the moment triage starts. Freeze a provenance snapshot before anything moves. Route to owners without the Slack scavenger hunt. Hand investigators a prioritized checklist instead of a blank editor. Do those four things and MTTI stops being a mystery you rediscover every incident — it becomes a procedure that a first-year analyst can run at 8am with roughly the same speed as your most experienced person.
That's the whole point of a metric lineage incident playbook: it moves the expertise out of people's heads and into the workflow, so the clock that used to kill you becomes the clock you actually control.
Ready to elevate your business intelligence?
Join 2,500+ businesses leveraging Glasaly to drive smarter decisions, improve team alignment, and boost operational performance.