



Three weeks ago I got a panicked call from an operations director at a 400-person manufacturing company. Their board meeting had just imploded. The CFO presented revenue per employee at $285K. The COO showed $312K. HR claimed $267K. Same metric name, three different calculations, and suddenly nobody trusted any number in the deck.
This wasn't incompetence. Each department had valid reasons for their calculation method. Finance excluded contractors. Operations included them but removed seasonal workers. HR counted everyone with a company email. The real problem? They'd been reporting these conflicting numbers for eighteen months and nobody noticed until the board did.
The hidden cost of metric anarchy
Most businesses don't realize they have a metric taxonomy problem until something expensive breaks. You've got marketing measuring customer acquisition cost one way, finance calculating it differently, and the board wondering why profitability projections keep missing. Each team builds their own definitions in isolation, creating what eventually becomes an unmanageable web of conflicting truths.
This pattern destroys operational visibility at companies ranging from 50-person agencies to thousand-employee distributors. The damage compounds as organizations grow. What starts as minor inconsistencies between departments evolves into complete breakdowns in strategic decision-making.
A regional healthcare network discovered they had seventeen different definitions of "patient visit" across their systems. Billing counted every interaction. Clinical only counted in-person appointments. Digital health tracked virtual sessions separately. Quality assurance excluded follow-ups within 48 hours. They couldn't answer basic questions about capacity, couldn't forecast staffing needs, and kept making expansion decisions based on fundamentally flawed data.
The worst part about metric sprawl is how it creates false confidence. Teams make critical decisions believing their numbers are accurate, unaware that other departments are operating from completely different baselines. By the time the inconsistencies surface, you've already committed resources, set targets, and made promises based on fiction.
Why metric definitions drift apart
Every metric starts clean. Someone creates a simple calculation, documents it somewhere, and moves on. Then reality hits.
Stop missing critical business insights.
Glasaly helps you create, share, and track interactive dashboards effortlessly.
- Real-time data visualization
- Collaborative report sharing
- Customizable analytics widgets
No credit card required
The sales team needs to adjust the customer count formula to exclude trial users because it makes their conversion rates look terrible. Finance wants to include trials because they impact server costs. Product needs a third definition that counts active trial users differently from inactive ones. Within six months, "customer count" means three different things depending on who you ask.
This drift accelerates when businesses add new channels, products, or operational complexity. That straightforward "average order value" calculation gets messy when you add wholesale accounts with volume discounts. "Employee productivity" becomes meaningless when you introduce remote workers with different hour tracking systems. "Customer lifetime value" calculations break when subscription models mix with one-time purchases.
Organizational growth accelerates metric chaos exponentially. When you're 20 people, everyone knows how numbers are calculated because the same person probably builds all the reports. At 200 people, you've got multiple analysts creating metrics independently. At 2,000, entire departments run their own analytics stacks with no central oversight.
Tool proliferation makes everything worse. Marketing runs attribution through HubSpot. Sales tracks pipeline in Salesforce. Finance pulls data from NetSuite. Customer success uses Gainsight. Each platform has its own logic, its own definitions, and its own version of truth. Even when teams try to align, the tools themselves force different calculations.
What breaks when metrics fragment
Fragmented metrics create cascading failures across operations. You can't optimize what you can't consistently measure, and you definitely can't coordinate when departments operate from different realities.
Budget planning becomes a nightmare. A software company allocated $2M for customer acquisition based on marketing's CAC calculations, only to discover finance's version showed they needed $3.2M to hit the same targets. Marketing thought CAC was $450. Finance calculated it at $720 after including overhead allocation and support costs during onboarding. Both were technically correct based on their definitions, but the gap destroyed their growth plans.
Performance management turns into constant arguments. Sales hits their "qualified lead" targets but marketing says those aren't really qualified. Customer success claims they've reduced churn to 5% monthly while finance shows 8% because they measure from different starting points. Compensation decisions, resource allocation, and strategic priorities all suffer when nobody agrees on basic performance indicators.
The coordination tax becomes enormous. Instead of focusing on improvement, teams waste countless hours in meetings debating whose numbers are right. A mid-size logistics company estimated they spent 500 hours annually just reconciling metric definitions between departments. That's twelve weeks of full-time work just arguing about what numbers mean.
Strategic decisions become impossible. You can't set realistic targets when baseline metrics vary by department. You can't identify real problems when everyone's dashboard shows different stories. One retail chain delayed their expansion for six months because they couldn't determine actual store-level profitability. Each region calculated it differently, making it impossible to identify which model to replicate.
Building a metric taxonomy that actually works
The companies with functional metric governance share certain patterns. It's not about perfection – it's about creating clear ownership, documentation, and change control processes that people will actually follow.
Start with a metric inventory audit. List every KPI currently tracked across the organization. For each one, document who creates it, how it's calculated, where the data comes from, and who uses it for decisions. This usually reveals shocking redundancy. One company found they were calculating monthly recurring revenue fourteen different ways.
The metric definition template that prevents chaos
Every metric needs a single source of truth document. Here's the template that actually gets used:
| Component | Description |
|---|---|
| Metric Name | Official name across all systems |
| Business Owner | Single person, not a committee |
| Technical Owner | Who maintains the calculation |
| Definition | Plain English explanation |
| Formula | Exact calculation with field names |
| Data Sources | Specific tables/systems |
| Refresh Frequency | How often it updates |
| Historical Changes | Track all modifications |
| Dependencies | Other metrics this impacts |
| Usage Rights | Who can modify vs. view |
The business owner component is critical. Without single-point accountability, metrics drift back into chaos within months. This person doesn't need to be senior, but they need clear authority to reject unauthorized changes and escalate conflicts.
Assign one clear business owner with authority to approve or reject metric changes to prevent rapid drift.
Creating enforceable governance gates
Documentation without enforcement is just wishful thinking. You need hard gates that prevent metric chaos from creeping back.
-
No new metrics without approval - Anyone wanting to track something new submits a proposal to the metrics governance board. This sounds bureaucratic but it prevents duplicate metrics and forces teams to check if something similar already exists. The approval process should be fast – max 72 hours for standard metrics, same-day for variations of existing ones.
-
Quarterly certification - Every metric owner confirms their definitions haven't changed and the calculations still reflect business reality. This catches drift before it becomes critical. One logistics company discovered during certification that their "on-time delivery" metric hadn't been updated after they changed delivery partners, making six months of performance data worthless.
-
Change control process - Any modification to an existing metric requires documentation of what changed, why, impacts on historical data, and sign-off from all downstream users. A financial services firm avoided disaster when this process caught that a seemingly minor change to their risk scoring metric would have invalidated $50M in loan decisions.
A financial services firm avoided disaster when this process caught that a seemingly minor change to their risk scoring metric would have invalidated $50M in loan decisions.
The practical rollout sequence
Implementing metric taxonomy without disrupting operations requires careful sequencing. Companies try to fix everything at once and create paralysis. The approach that works focuses on highest-impact metrics first while building governance muscles gradually.
Start with revenue metrics. These directly impact financial reporting and strategic decisions, making them natural candidates for initial standardization. Map out every revenue-related calculation across departments, identify discrepancies, and force alignment. This usually takes 2-3 weeks of focused effort but immediately improves forecast accuracy and budget planning.
Next, tackle operational efficiency metrics. These typically have the most variations between departments. Manufacturing companies might have dozens of productivity calculations. Service businesses often track utilization ten different ways. Standardizing these creates immediate operational improvements because teams can finally benchmark performance accurately.
Customer metrics come third. CAC, lifetime value, churn, satisfaction scores – these tend to be politically charged because they impact multiple departments. By this point, you've built governance credibility with revenue and operational metrics, making it easier to navigate the political complexity of customer metric standardization.
Leave vanity metrics for last. Every department has metrics they track but don't really drive decisions from. Don't waste governance capital fighting about these. Focus on metrics that actually influence resource allocation, strategy, and compensation.
The diagram below outlines the phased rollout workflow.
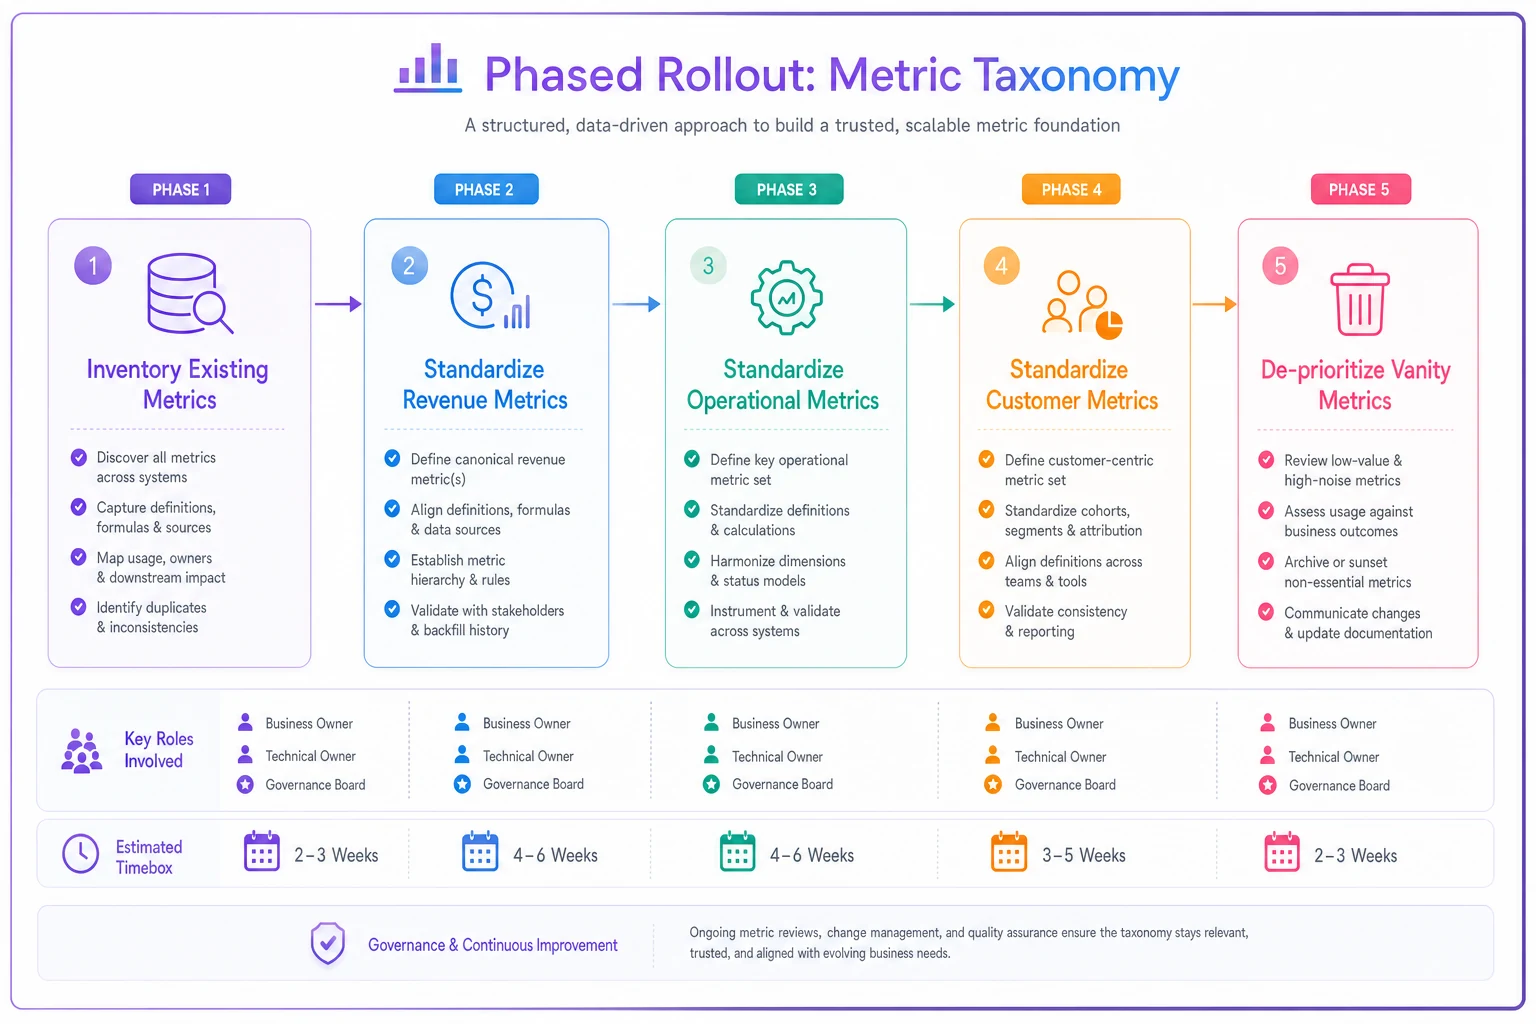
Start with revenue to get early wins, then expand to operational and customer metrics while leaving vanity metrics last to preserve governance bandwidth.
The owner responsibility matrix that maintains clarity
Metric Business Owner:
-
Defines business logic and use cases
-
Approves any calculation changes
-
Resolves conflicts between departments
-
Reviews quarterly for continued relevance
-
Manages stakeholder communication
Technical Implementation Owner:
-
Maintains calculation logic
-
Ensures data quality and accuracy
-
Documents technical dependencies
-
Handles source system changes
-
Manages refresh schedules
Governance Board:
-
Approves new metrics
-
Arbitrates definition conflicts
-
Reviews quarterly certifications
-
Manages sunset process for obsolete metrics
-
Enforces compliance
End Users:
-
Follow approved definitions
-
Report discrepancies immediately
-
Request changes through proper channels
-
Participate in quarterly reviews
The key is making these roles explicit and public. Everyone should know who owns what metric and how to request changes or report issues.
Technology enablement without complexity
The right operational software can enforce metric governance automatically, but most companies overcomplicate this. You don't need a massive data governance platform. You need basic automation that enforces consistency.
Modern AI-powered operational platforms can maintain a central metric repository that all reporting pulls from. Instead of each department building their own calculations, everyone references the same source. When the calculation needs updating, it changes in one place and propagates everywhere. This alone eliminates most consistency issues.
The automation aspect becomes valuable for detecting drift before it becomes critical. Automated systems can flag when different departments start calculating similar metrics differently, when source data quality degrades, or when calculation logic produces unexpected results. It's like having a full-time governance analyst watching for problems, except it never misses patterns and works continuously.
Some companies try building this themselves with spreadsheets and documentation wikis. This works initially but breaks down as complexity grows. The manual overhead of maintaining governance documentation eventually overwhelms teams, and they stop updating it. That's when metric definitions start drifting again.
AI-assisted operational platforms reduce this maintenance burden significantly. They can automatically detect when new metrics are created that might duplicate existing ones, suggest standardized calculations based on industry patterns, and maintain version control for all definition changes. The technology handles the repetitive governance tasks so humans can focus on the strategic decisions.
Measuring governance effectiveness
How do you know if your metric taxonomy is actually working? Track these indicators:
Definition conflicts per quarter: Should decrease by 80% within six months. If conflicts keep appearing, your change control process has gaps.
Time to resolve metric disputes: Should drop from days to hours. Clear ownership and documentation eliminate most debates immediately.
Metric calculation variations: Count how many versions of each key metric exist. This should approach 1.0 for all critical KPIs within a year.
Stakeholder trust scores: Survey key users quarterly about their confidence in reported numbers. Low trust indicates governance breakdown even if technical consistency looks good.
Decision reversal rate: Track how often decisions change because someone discovers metrics were calculated incorrectly. This should approach zero for governed metrics.
Common failure modes to avoid
Even with solid governance, certain patterns repeatedly break metric taxonomy.
Governance theater is the most common failure. Companies create elaborate documentation and approval processes but don't enforce them. Teams quickly learn they can bypass governance without consequences, and the entire system collapses. One technology company spent $200K on governance tools and training, but because they never rejected a single metric request or enforced change control, they had more metric chaos a year later than when they started.
Committee ownership never works. When everyone owns a metric, no one does. A healthcare system assigned metric ownership to committees instead of individuals. Six months later, nobody could explain why key calculations had changed because committee members all thought someone else was responsible.
Over-engineering governance kills adoption. If requesting a simple metric change requires six approvals and takes two weeks, teams will build shadow metrics outside the system. Keep the process lightweight enough that following it is easier than working around it.
Ignoring technical debt compounds problems. Legacy systems often can't support standardized calculations without significant refactoring. One distribution company discovered their ERP system hardcoded different logic in various modules, making true standardization impossible without a system upgrade. Address these constraints early or they'll undermine everything else.
The timeline to metric clarity
Realistic implementation timelines vary by company size and complexity, but the pattern stays consistent.
Month 1-2: Inventory existing metrics and document current state. This reveals the true scope of metric sprawl. Most companies discover they're tracking 3-4x more metrics than they realized, with massive overlap and contradiction.
Month 3-4: Establish governance structure and standardize first wave (usually 20-30 critical metrics). Focus on metrics that directly impact financial reporting or strategic decisions. Get early wins to build credibility.
Month 5-6: Expand to operational metrics and implement enforcement mechanisms. This is when you'll face the most resistance as departments lose their ability to define metrics favorably. Stay strong – this is where real value emerges.
Month 7-9: Complete standardization for all decision-critical metrics. Address technical barriers and tool consolidation. Begin sunsetting redundant or unused metrics.
Month 10-12: Achieve steady-state governance with quarterly reviews and continuous improvement. By now, the organization operates from a single source of truth and can make decisions confidently.
Smaller organizations (under 200 people) can compress this timeline to 6 months. Larger enterprises might need 18-24 months for full implementation, especially if they have multiple business units or geographic regions.
Real-world implementation story
A $30M industrial equipment distributor faced a crisis when their bank questioned their financial metrics during a loan review. Different departments showed different growth rates, margins, and customer concentration numbers. The inconsistency nearly killed their credit line expansion.
They started by mapping their metric chaos. Sales tracked revenue when orders were placed. Finance recognized it when shipped. Accounting booked it when paid. The warehouse had a fourth definition based on when items left the dock. Same company, four different revenue numbers, with gaps up to 15% in any given month.
The first step was establishing single ownership. The CFO became the business owner for all financial metrics, with clear authority to override department preferences. The operations VP owned all fulfillment metrics. The sales director controlled pipeline and conversion metrics. No committees, no shared ownership, just clear accountability.
They documented every metric using a simple template in a shared platform accessible to everyone. Each definition included the exact SQL query or Excel formula used, eliminating ambiguity. Historical changes were tracked so everyone understood why and when calculations evolved.
The enforcement mechanism was straightforward but effective. No report could be presented to leadership without referencing the official metric definitions. Any variance required written explanation and approval. This sounds heavy-handed but it worked because it applied to everyone, including the CEO.
Within four months, they'd standardized 47 core metrics. Revenue recognition aligned across all departments. Inventory calculations matched between warehouse and finance. Customer metrics meant the same thing to sales and service. The practical impact was immediate. Board meetings stopped devolving into arguments about whose numbers were right. The bank approved their credit expansion based on confidence in their reporting.
They implemented operational software with built-in metric governance six months in. The platform enforced definition consistency automatically and flagged when anyone tried creating duplicate metrics. This reduced the manual governance overhead by roughly 70%, making the system sustainable long-term.
A year later, they'd eliminated about $400K in annual waste that was hidden by metric inconsistencies. Inventory carrying costs were 20% higher than reported because of calculation differences. Customer acquisition costs were underestimated by 35%, leading to unprofitable campaign investments. Sales productivity was overstated because different regions measured it differently, masking underperforming teams.
Making governance stick long-term
The difference between temporary metric cleanup and permanent governance comes down to embedding it into operations rather than treating it as a separate initiative.
Make metric certification part of quarterly business reviews. Just as you review financial performance, review metric health. Which definitions changed? Why? What new metrics were requested? This keeps governance visible and prevents drift.
Build metric governance into role expectations. Include it in job descriptions for analyst roles. Make it part of performance reviews for metric owners. When governance becomes part of someone's actual job rather than extra work, it gets done consistently.
Automate everything possible. Manual governance processes eventually fail because people get busy with other priorities. Use operational platforms that enforce governance rules automatically. Set up alerts when metrics drift from baselines or when multiple similar metrics get created.
Create positive reinforcement for good governance. Celebrate teams that maintain clean metrics. Share stories about decisions that succeeded because of accurate data. Make governance valuable rather than punitive.
The companies that maintain strong metric taxonomy long-term treat it like any other critical business process. They invest in tools, assign clear ownership, measure performance, and continuously improve. Those that treat it as a one-time project inevitably slide back into metric chaos within 12-18 months.
The path forward
Metric sprawl isn't a technical problem – it's an organizational discipline problem that technical solutions can help solve. Every company beyond startup stage faces this challenge. The ones that thrive build governance systems before the chaos becomes critical.
Start small but start now. Pick your five most critical metrics and establish clear ownership and documentation for those. Build from that foundation rather than trying to fix everything simultaneously. Use the templates and processes outlined here, but adapt them to your organization's culture and constraints.
The investment in metric taxonomy pays off quickly through better decisions, less wasted time in meetings, and improved operational efficiency. More importantly, it creates the foundation for sustainable growth. You can't scale operations effectively when different parts of the organization operate from different versions of truth.
Remember that perfect governance isn't the goal – functional governance is. Focus on metrics that drive real decisions. Enforce consistency
Ready to elevate your business intelligence?
Join 2,500+ businesses leveraging Glasaly to drive smarter decisions, improve team alignment, and boost operational performance.