

Three weeks ago, a distribution company's CFO called an emergency meeting. Revenue had dropped 18% month-over-month, but operations insisted delivery times were normal, sales showed pipeline growth, and customer success reported satisfaction scores holding steady. Everyone had data backing their claims. Nobody could explain the revenue crater.
This scenario plays out constantly. A critical metric tanks while surface-level indicators look healthy. Teams scramble through dashboards, argue about data accuracy, and waste days chasing false leads. By the time someone finds the actual problem—in this case, a pricing update that accidentally excluded volume discounts for 30% of orders—the damage has already compounded.
Most businesses approach root cause investigation backwards. They start with whatever data is easiest to pull, check obvious suspects, then gradually work deeper. This scattered approach burns time and misses connections between operational layers.
The investigation hierarchy that actually finds problems
Real root cause investigation follows a strict diagnostic order. Not because it's theoretically correct, but because certain problem types hide others. Check revenue before checking order volume. Check order volume before checking individual SKU performance. The sequence matters.
Start with business-critical metrics:
-
Total revenue (daily/weekly variance)
-
Gross margin percentage
-
Cash conversion cycle
-
Customer acquisition cost vs lifetime value
Then move to operational flow:
-
Order-to-fulfillment time
-
Inventory turnover rate
-
Production capacity utilization
-
Support ticket resolution time
Finally examine components:
-
Individual product line performance
-
Channel-specific conversion rates
-
Employee productivity by department
-
Vendor delivery reliability
Problems cascade downward. A fulfillment delay shows up in revenue metrics before it appears in shipping reports. A supplier quality issue impacts margin before individual SKU complaints spike. The distribution company? They spent two days analyzing marketing attribution and sales territory performance. Had they started with order-level margin analysis, they would have spotted the pricing configuration issue within hours.
Query templates that expose hidden operational failures
Generic database queries rarely catch operational problems. You need queries specifically structured to detect anomalies across time periods, segments, and operational layers.
Stop missing critical business insights.
Glasaly helps you create, share, and track interactive dashboards effortlessly.
- Real-time data visualization
- Collaborative report sharing
- Customizable analytics widgets
No credit card required
Revenue Degradation Query Pattern
-- Compare current period to multiple baselines WITH currentperiod AS ( SELECT DATETRUNC('day', orderdate) as day, SUM(revenue) as dailyrevenue, COUNT(DISTINCT customerid) as uniquecustomers, AVG(ordervalue) as avgordervalue FROM orders WHERE orderdate >= CURRENTDATE - INTERVAL '7 days' GROUP BY 1 ), historicalbaseline AS ( SELECT AVG(dailyrevenue) as avgdailyrevenue, STDDEV(dailyrevenue) as revenuestddev FROM ( SELECT DATETRUNC('day', orderdate) as day, SUM(revenue) as dailyrevenue FROM orders WHERE orderdate BETWEEN CURRENTDATE - INTERVAL '37 days' AND CURRENTDATE - INTERVAL '7 days' GROUP BY 1 ) hist ) SELECT c.day, c.dailyrevenue, h.avgdailyrevenue, (c.dailyrevenue - h.avgdailyrevenue) / h.revenuestddev as zscore, c.uniquecustomers, c.avgordervalue FROM currentperiod c CROSS JOIN historicalbaseline h WHERE ABS((c.dailyrevenue - h.avgdailyrevenue) / h.revenue_stddev) > 2 ORDER BY c.day DESC;
This catches revenue anomalies while providing context about whether the problem stems from customer count or order value changes.
Operational Bottleneck Detection Query
-- Find process stages with increasing wait times WITH stagetimes AS ( SELECT orderid, status, LAG(updatedat) OVER (PARTITION BY orderid ORDER BY updatedat) as prevtime, updatedat, EXTRACT(EPOCH FROM (updatedat - LAG(updatedat) OVER (PARTITION BY orderid ORDER BY updatedat)))/3600 as hoursinstage FROM orderstatushistory WHERE updatedat >= CURRENTDATE - INTERVAL '14 days' ), stageanalysis AS ( SELECT status, DATETRUNC('day', updatedat) as day, PERCENTILECONT(0.5) WITHIN GROUP (ORDER BY hoursinstage) as medianhours, PERCENTILECONT(0.9) WITHIN GROUP (ORDER BY hoursinstage) as p90hours, COUNT(*) as volume FROM stagetimes WHERE hoursinstage IS NOT NULL AND hoursinstage < 168 -- exclude obvious data errors GROUP BY 1, 2 ) SELECT status, day, medianhours, p90hours, volume, medianhours - LAG(medianhours, 7) OVER (PARTITION BY status ORDER BY day) as weekoverweekchange FROM stageanalysis WHERE day >= CURRENTDATE - INTERVAL '7 days' ORDER BY status, day;
These patterns work across industries. Swap "orders" for "tickets" in support, or "projects" in professional services. The structure remains: compare multiple time windows, calculate deviations, surface both the anomaly and operational context.
Communication templates that prevent investigation chaos
When metrics crater, communication breaks down immediately. Engineering blames data quality. Sales blames operations. Operations blames vendors. Without structured protocols, investigations become finger-pointing sessions.
Initial Alert Template (sent within 15 minutes of detection)
OPERATIONAL ALERT: [Metric Name] variance detected Metric: [Specific metric name] Current Value: [Value] Expected Range: [Lower bound - Upper bound] Deviation: [X% or X standard deviations] Detection Time: [Timestamp] Initial Impact Assessment:
-
Affected Systems
[List systems/processes]
-
Estimated Revenue Impact
[$ amount or "calculating"]
-
Customer Impact
[None/Minor/Major with specifics]
Investigation Lead: [Name] Status Update ETA: [Time, max 2 hours from now] DO NOT REPLY-ALL. Updates will follow in designated channel.
Investigation Update Template (every 2 hours during active investigation)
INVESTIGATION UPDATE #[Number] Status: [Investigating/Root Cause Identified/Implementing Fix/Monitoring] What We Know:
-
[Confirmed fact 1]
-
[Confirmed fact 2]
What We've Ruled Out:
-
[System/cause eliminated] - [How verified]
-
[System/cause eliminated] - [How verified]
Current Hypothesis: [One sentence description]
Next Steps:
-
[Specific action] - Owner
[Name] - ETA: [Time]
-
[Specific action] - Owner
[Name] - ETA: [Time]
Data Requests:
-
Need [specific data] from [team] by [time]
Next Update: [Time]
The diagnostic decision tree that eliminates guesswork
Random troubleshooting wastes time. You need a systematic approach that narrows possibilities based on operational patterns.
The following workflow visualizes the decision tree used to triage revenue-impact incidents.
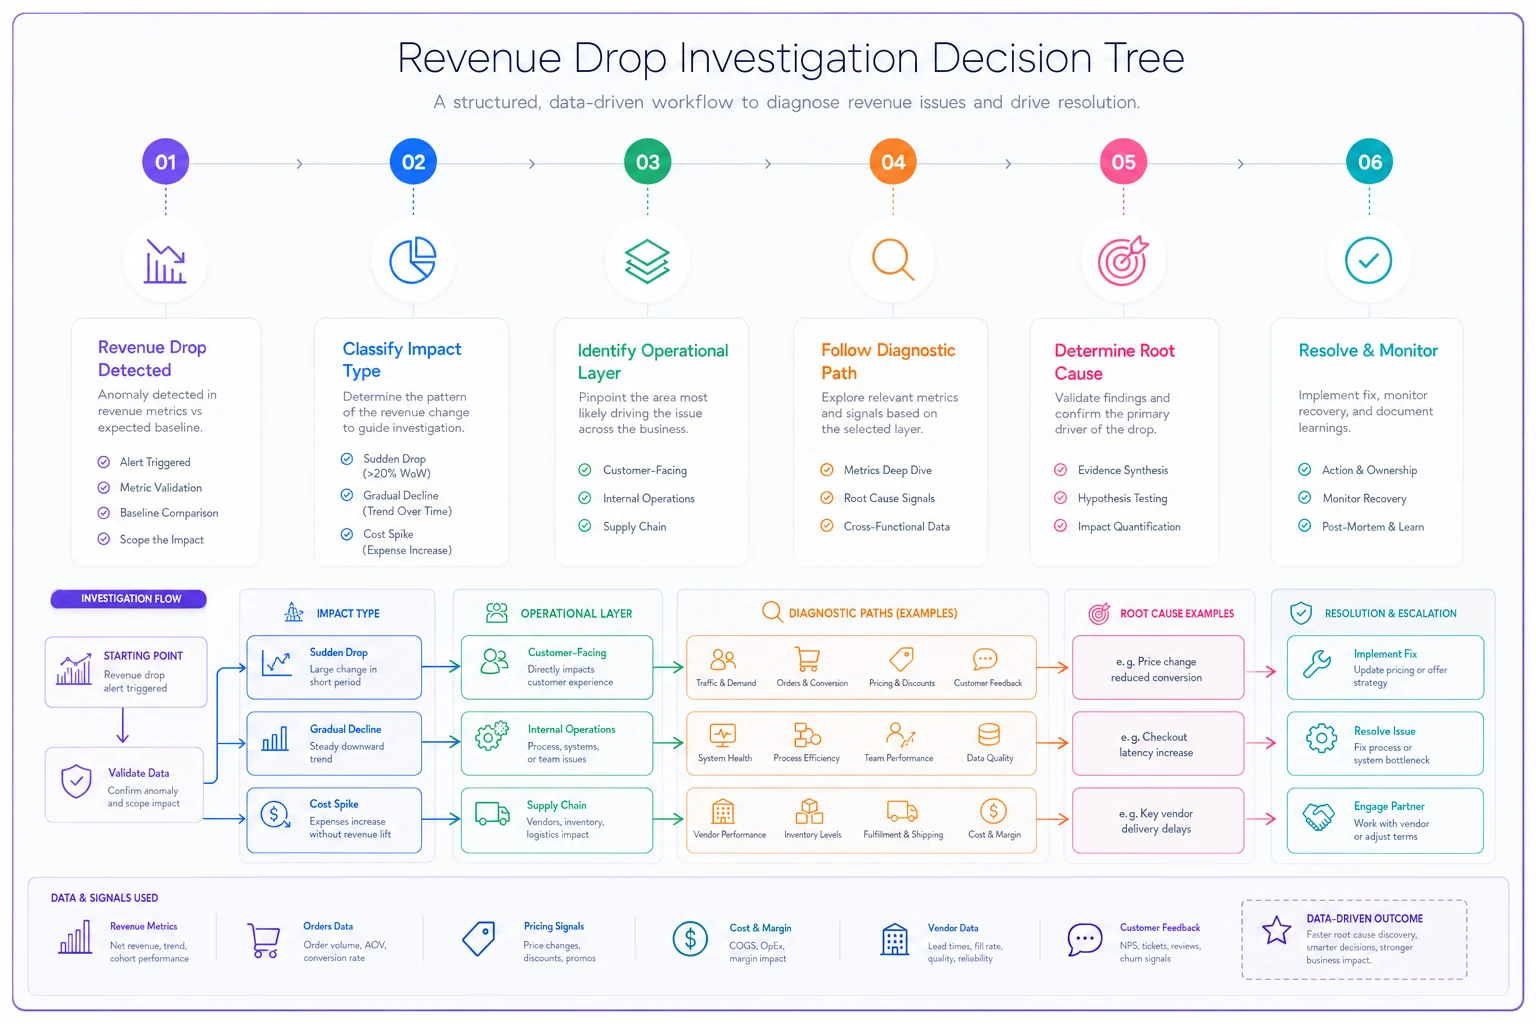
Primary Branch: Revenue Impact Type
If revenue drop is sudden (>10% in single day):
-
Check payment processing first
-
Then check major customer accounts
-
Then check pricing/discount configurations
-
Finally check order volume
If revenue erosion is gradual (2-3% weekly):
-
Check conversion rates first
-
Then check average order value trends
-
Then check customer segment mix
-
Finally check competitive actions
If revenue is flat but costs spike:
-
Check supplier pricing changes first
-
Then check shipping rate updates
-
Then check overtime/labor costs
-
Finally check inventory carrying costs
Secondary Branch: Operational Layer
For customer-facing issues:
-
Check support ticket categories for spike patterns
-
Review checkout funnel drop-off points
-
Analyze customer cohort behaviors
-
Examine channel-specific performance
For internal process issues:
-
Measure stage-to-stage conversion rates
-
Compare processing times to baseline
-
Check system error logs for patterns
-
Review recent configuration changes
For supply chain issues:
-
Check vendor performance metrics
-
Review inventory stock-out patterns
-
Analyze fulfillment accuracy rates
-
Examine returns/quality metrics
Each branch eliminates entire categories of problems, focusing effort on the highest-probability causes.
Sample investigation scenarios with actual queries
Scenario 1: Mysterious Tuesday revenue drops
A B2B equipment supplier noticed revenue dropped 25-30% every Tuesday for three weeks. Standard reports showed normal order counts and average order values.
SELECT EXTRACT(DOW FROM createdat) as dayofweek, EXTRACT(HOUR FROM createdat) as hour, COUNT(*) as orders, SUM(totalamount) as revenue, COUNT(DISTINCT CASE WHEN paymentstatus = 'failed' THEN orderid END) as failedpayments FROM orders WHERE createdat >= CURRENTDATE - INTERVAL '30 days' GROUP BY 1, 2 ORDER BY 1, 2;
Result: Payment processor ran maintenance every Tuesday 2-4 AM, but their notification system listed times in GMT, not local timezone. Overseas customers couldn't complete purchases during peak buying windows.
Scenario 2: Gradual margin erosion
An ecommerce retailer's gross margin slipped from 42% to 38% over two months. Product mix looked stable, no major pricing changes.
| Investigation Areas | Results Found |
|---|---|
| Product costs | No significant changes |
| Shipping methods | Free shipping threshold misaligned |
| Discount patterns | Normal application rates |
| Order splitting | Increased 40% over period |
WITH orderdetails AS ( SELECT o.orderid, o.createdat, o.shippingmethod, o.totalamount, o.shippingcost, o.discountamount, SUM(oi.quantity p.cost) as totalcost FROM orders o JOIN orderitems oi ON o.orderid = oi.orderid JOIN products p ON oi.productid = p.productid WHERE o.createdat >= CURRENTDATE - INTERVAL '90 days' GROUP BY 1,2,3,4,5,6 ) SELECT DATETRUNC('week', createdat) as week, shippingmethod, AVG(shippingcost) as avgshippingcost, AVG(CASE WHEN totalamount > 100 THEN shippingcost ELSE NULL END) as avgshippinghighvalue, COUNT() as ordercount, SUM(shippingcost) / SUM(totalamount) as shippingpctofrevenue FROM order_details GROUP BY 1, 2 ORDER BY 1, 2;
Discovery: Free shipping threshold hadn't adjusted when shipping rates increased 15%. Customers split orders to stay under the threshold, doubling shipping costs per customer.
The postmortem checklist that prevents repeat failures
Most postmortems focus on what went wrong. Effective ones for operations focus on why detection took so long and how to catch it faster.
Essential Components:
-
[ ] Timeline with detection delay analysis
-
[ ] Detection failure points
-
[ ] Investigation efficiency review
-
[ ] Operational impact beyond the obvious
-
[ ] Prevention mechanisms (specific and measurable)
The timeline section needs specifics:
-
When did the problem actually start?
-
When should automated alerts have triggered?
-
When did humans notice?
-
What was the gap between each stage?
Detection failure analysis should cover:
-
Which metrics should have caught this?
-
Why didn't existing alerts fire?
-
What dashboard would have shown the issue?
-
Which reports missed the signal?
Investigation efficiency review examines:
-
Time spent on wrong paths
-
Data that would have shortened investigation
-
Communication delays or confusion
-
Tools or access issues
The "Next Time" Test
Every postmortem must answer: "If this exact problem happened again tomorrow, would we catch it in under 2 hours?" If no, you need either an automated alert, scheduled query, process change, or dashboard update. A furniture manufacturer's postmortem revealed their 6-day fulfillment investigation could have taken 2 hours with proper alerting. They built 4 new monitors and caught a similar issue the following month within 45 minutes, saving around $180-220k in expedited shipping.
How AI-powered platforms transform chaotic investigations
Manual root cause investigation breaks down at scale. When juggling multiple systems, dozens of data sources, and cross-functional teams, even solid playbooks struggle to stay organized.
Modern operational platforms incorporate AI automation to accelerate investigation cycles. Instead of manually running queries across systems, these platforms continuously analyze operational data patterns and surface anomalies with context about likely causes.
The value isn't just detection—it's investigation workflow automation. When AI agents identify an issue, they pull relevant historical data, check for similar past incidents, and compile initial diagnostic reports. This transforms the critical first hour from frantic data gathering to focused problem solving.
For the distribution company with pricing issues, an AI-enhanced platform would have detected the margin anomaly within hours, compared it to historical patterns, and flagged specific customer segments seeing different prices. The 2-day investigation becomes a 2-hour fix.
These platforms also maintain investigation history. When similar patterns emerge, teams immediately see what caused it before and what fixed it. Institutional knowledge typically lost when employees leave becomes embedded in operational workflow.
When investigation playbooks work vs when they fail
A root cause investigation playbook only works when your operational data has basic integrity. If order statuses update randomly, timestamps are inconsistent, or key fields contain garbage, even perfect processes fail.
This approach works when:
-
Transaction data updates in near-real-time (within 1-2 hours)
-
You have at least 30 days of historical data for baselines
-
Core operational metrics are defined consistently
-
Teams have query access to production data
-
Communication channels are established and monitored
Skip this when:
-
You're running on spreadsheets updated weekly
-
Different departments define metrics differently
-
Data lives in completely disconnected systems
-
Your operation changes fundamentally every few weeks
-
You have fewer than 100 transactions monthly
Small operations sometimes try implementing sophisticated investigation processes before establishing data basics. A 20-person services company spent weeks building investigation dashboards while their time tracking system had 40% missing entries. Fix the foundation first.
Building investigation muscle memory across your team
The best playbook becomes useless if only one person knows how to use it. Operational investigations need to become muscle memory across teams.
Start with weekly "fire drills" using historical incidents. Take a real problem from 6 months ago, hide the resolution, and have teams work through the investigation process. This builds pattern recognition before real problems hit.
Document every investigation as a searchable case study. Include the initial symptom reported, incorrect hypotheses pursued, the query or analysis that found the issue, time spent on each phase, and the actual root cause and fix.
Some operations teams maintain a "problem pattern library"—symptoms mapped to likely causes based on historical investigations:
-
When revenue drops on Tuesdays, they check scheduled maintenance windows
-
When margin erodes gradually, they check shipping thresholds and discount configurations first
-
When customer complaints spike without obvious product issues, they examine recent process changes
When running drills, time each phase to identify slow steps.
The goal isn't eliminating investigation time—it's compressing the path from detection to root cause from days to hours. Every hour of confusion compounds into customer impact, team stress, and revenue loss.
Three months after implementing structured root cause processes, that distribution company reduced average problem resolution from 4.2 days to 11 hours. Not through better technology or more analysts, but through systematic investigation methods that eliminated guesswork.
The difference between operations that scramble and operations that solve comes down to investigation discipline. Following the diagnostic hierarchy, using targeted queries, maintaining structured communication, and building investigation muscle memory across teams transforms how you handle crises.
When the next operational crisis hits—and it will—you'll have the framework to find and fix it quickly instead of burning days on scattered troubleshooting.
Ready to elevate your business intelligence?
Join 2,500+ businesses leveraging Glasaly to drive smarter decisions, improve team alignment, and boost operational performance.