
Most companies treat analytics observability like it's IT's problem. Set up some database monitoring, throw in a few data quality checks, call it done. But what actually ends up happening is that analysts own the metrics driving business decisions, yet they're completely blind when those metrics break.
This plays out constantly in mid-sized operations. Marketing reports conversion rates are down 40% overnight. Finance notices revenue calculations suddenly don't match. Operations sees inventory metrics spike for no obvious reason. By the time anyone notices, the damage is done — wrong decisions made, budgets wasted, trust eroded.
The real problem isn't that metrics break. It's that analyst teams have no systematic way to know when they break, how badly, or who's supposed to fix what. You end up with a reactive scramble where everyone's manually checking their own numbers and hoping they catch issues before executives do.
Why traditional monitoring fails analyst teams
Database monitoring tells you tables exist. APM tools track query performance. Data quality platforms check for nulls and duplicates. None of these answer what analysts actually need to know: are the metrics stakeholders rely on still trustworthy?
Think about a typical retail analytics setup. Conversion metrics pull from web analytics, inventory metrics from an ERP, revenue calculations combine multiple sources. Each has different update frequencies, different failure modes, different business consequences when things go wrong.
-
Source data arrives late (not a real problem if it catches up)
-
Calculation logic changed upstream (huge problem — historical data is now wrong)
-
New product categories weren't mapped (a growing blind spot)
-
Session tracking broke (catastrophic — all downstream analysis is invalid)
Standard monitoring flags all of these the same way: "data quality issue detected." But the response, urgency, and responsible owner should be completely different for each scenario. That's where analyst-specific observability actually matters.
Building metric SLOs that actually work
Service Level Objectives for analytics need to reflect how the business uses metrics, not just whether data exists. Here's a framework that holds up in practice:
Stop missing critical business insights.
Glasaly helps you create, share, and track interactive dashboards effortlessly.
- Real-time data visualization
- Collaborative report sharing
- Customizable analytics widgets
No credit card required
| Tier | SLO | Examples |
|---|---|---|
| Tier 1: Decision-Critical Metrics | SLO: 99.9% accuracy, under 1 hour freshness | Examples: daily revenue, inventory levels, conversion rates |
| Tier 2: Planning Metrics | SLO: 99% accuracy, under 6 hour freshness | Examples: customer acquisition cost, product mix analysis |
| Tier 3: Exploratory Analytics | SLO: 95% accuracy, under 24 hour freshness | Examples: segment deep-dives, experimental metrics |
Not all metrics deserve the same monitoring intensity. A retail operation might have 500+ metrics in their BI tool, but realistically only 20 or 30 need Tier 1 treatment. Trying to monitor everything at Tier 1 is how you end up drowning in alerts that nobody takes seriously.
Data quality checks that catch real problems
Generic data quality checks waste everyone's time. "Row count decreased by 5%" means nothing without context. Here's what actually catches issues that matter:
Business Logic Checks
Daily Revenue Sanity:
-
Total must be within 20% of 7-day average (unless marked holiday)
-
Average order value between $45-$250
-
Transaction count matches payment processor count ±2%
Relationship Checks
Customer Metrics Consistency:
-
New customers + returning customers = total customers
-
Customer count <= unique email count
-
Acquisition cost * new customers ≈ marketing spend ±15%
Trend Violation Checks
Inventory Turnover:
-
Week-over-week change <30% (unless new product launch)
-
No single SKU >40% of total movement
-
Stockout items <5% of active catalog
These checks incorporate business context. That's what separates useful analytics observability from noise generation.
Alert taxonomy that reduces fatigue
The biggest failure in monitoring is alert fatigue. When everything's urgent, nothing is. Here's a classification system that actually works:
Symptoms (user-facing issues) — things like "executive dashboard is blank," "conversion rate dropped 50% overnight," or "revenue numbers don't match finance."
Signals (technical indicators) — things like "ETL pipeline delayed 3 hours," "source table schema changed," or "join producing 30% more rows than expected."
Symptoms trigger immediate investigation. Signals get logged for correlation but don't wake anyone up unless they cascade into symptoms. That distinction alone can cut alert noise significantly — in some cases by more than half, depending on how noisy the environment was to begin with.
The ownership map nobody wants to build
Unclear ownership kills analytics observability faster than bad tooling. You need explicit ownership at three levels:
Metric Ownership
Conversion Rate
-
Definition Owner
Marketing Analytics (Sarah Chen)
-
Data Pipeline
Data Engineering (Marcus Rodriguez)
-
Business Interpretation
CMO (Jennifer Walsh)
-
Escalation
If >10% unexplained change
Source System Ownership
Web Analytics Platform
-
Technical Admin
IT (DevOps team)
-
Data Quality
Marketing Ops (Riley Thompson)
-
Schema Changes
Requires 5-day notice to analytics
-
Escalation
Any unplanned changes
Investigation Ownership
Revenue Metric Issues
-
First Responder
Finance Analytics (David Kim)
-
Escalation (30 min)
Senior Analyst (Patricia Moore)
-
Escalation (2 hours)
CFO notification
-
Required Artifacts
Investigation log, impact assessment
Without this map, issues bounce between teams while metrics stay broken. Nobody's being negligent — they genuinely don't know it's their problem to solve.
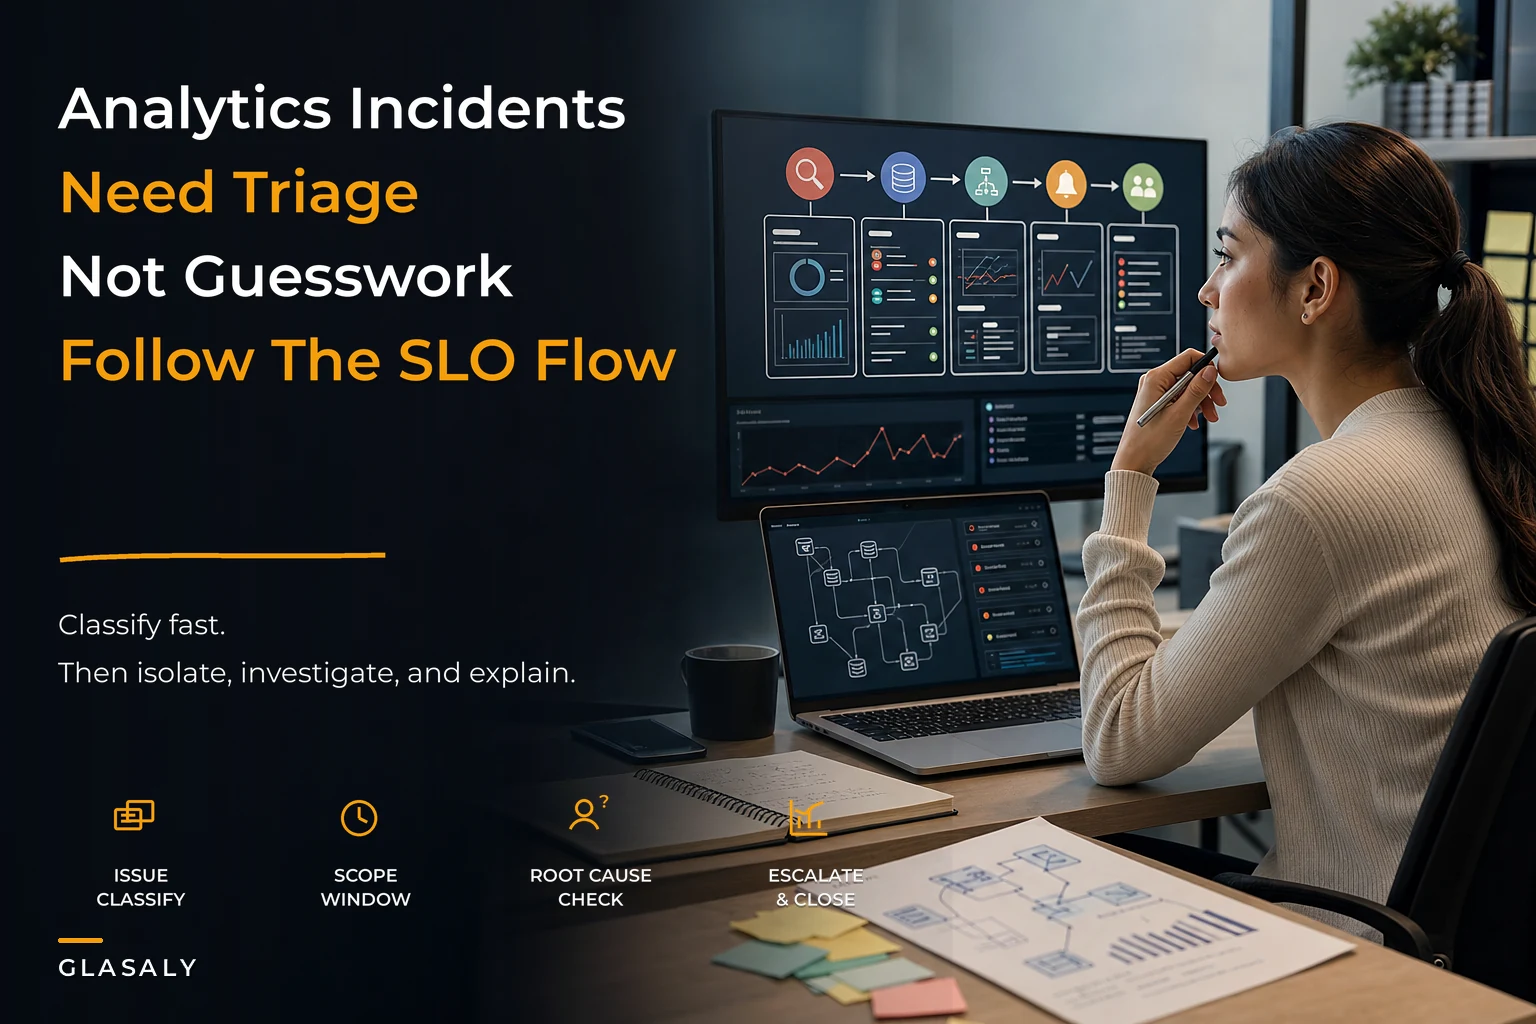
Investigation workflows that actually resolve issues
Random debugging wastes hours. A systematic investigation flow makes a real difference:
Phase 1: Classify the Issue (5 minutes)
-
Check if source data arrived
-
Verify calculation ran
-
Compare to yesterday's values
-
Note which metrics are affected
Phase 2: Isolate the Scope (15 minutes)
-
Single metric or multiple?
-
Specific dimension or all?
-
Point-in-time or ongoing?
-
Data issue or calculation issue?
Phase 3: Root Cause Investigation (30 minutes)
If it's a data issue:
-
Check row counts by source
-
Verify join keys matching
-
Look for new dimensional values
-
Review data freshness
If it's a calculation issue:
-
Compare calculation logic to last known good
-
Check for divide-by-zero or null handling
-
Verify business rule changes
-
Test with previous period's data
Phase 4: Document and Communicate
Issue: Conversion rate showed 0% for 6 hours on Oct 15 Root Cause: New product category 'Holiday Specials' not mapped Impact: Underreported conversions by ~$45K Fix: Added category mapping, backfilled calculations Prevention: Set up alert for unmapped categories
A concise workflow to follow during investigations.
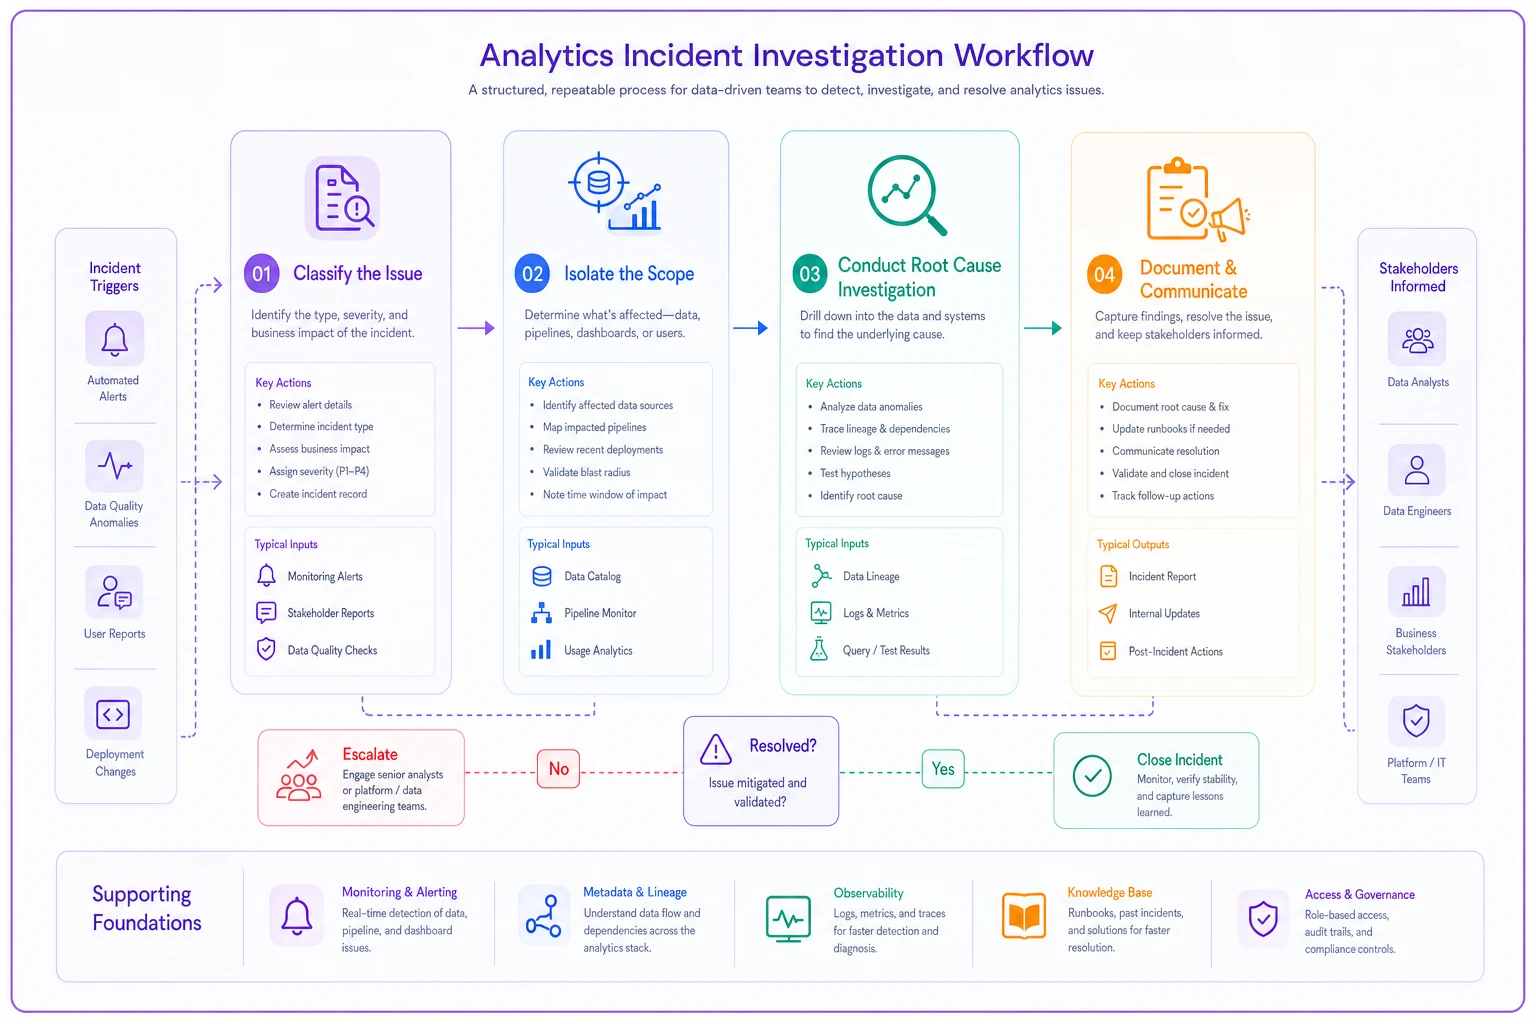
The structure forces fast resolution instead of endless investigation spirals. Skipping documentation feels fine in the moment — until the same issue happens three months later and nobody remembers how it was fixed.
Practical templates you can steal
SLO Definition Template
Metric: [Name] Tier: [1/2/3] Accuracy SLO: [99.9%/99%/95%] Freshness SLO: [1hr/6hr/24hr] Valid Range: [Business-specific bounds] Validation Query: [SQL to check metric] Owner: [Name and team] Escalation: [When and to whom]
Alert Configuration Template
Alert Name: [Descriptive name] Type: [Symptom/Signal] Condition: [Specific trigger logic] Severity: [Critical/Warning/Info] Notification: [Who gets alerted] Runbook Link: [Investigation steps] Auto-Recovery: [Yes/No and how]
Investigation Runbook Template
Metric: [Affected metric]
Common Causes:
-
[Most likely cause] - Check
[How to verify]
-
[Second cause] - Check
[How to verify]
-
[Third cause] - Check
[How to verify]
Quick Fixes:
-
[Temporary workaround]
-
[Data refresh command]
-
[Fallback calculation]
Escalation Path:
-
15 min
[First escalation]
-
1 hour
[Second escalation]
-
4 hours
[Executive notification]
Escalation Path: 15 min: [First escalation] 1 hour: [Second escalation] 4 hours: [Executive notification]
Coverage checklist for comprehensive monitoring
Most teams monitor about 20% of what actually matters. Here's a coverage audit worth running:
Data Pipeline Coverage
-
All source systems have freshness checks
-
Critical joins have row count validations
-
Schema changes trigger notifications
-
Failed runs auto-alert the appropriate owner
Metric Logic Coverage
-
Business rules documented and versioned
-
Calculation changes require approval
-
Test data validates calculations
-
Historical consistency checks run daily
Output Coverage
-
Executive metrics have dedicated SLOs
-
Customer-facing metrics monitored real-time
-
Finance metrics reconcile automatically
-
Operational metrics track to source systems
Process Coverage
-
Incident response plan exists
-
Postmortem template ready
-
Ownership matrix current
-
Escalation paths tested quarterly
Running this audit is uncomfortable. Most teams discover they have significant gaps in areas they assumed were covered.
When good metrics go bad silently
The scariest failures are the quiet ones. Revenue looks fine but it's missing an entire product line. Conversion rates seem stable but they're excluding mobile traffic. These issues can run for months before anyone notices.
One mid-size ecommerce company ran for three months with customer acquisition cost calculations that excluded their fastest-growing channel. The metric looked great — CAC down 30%. Reality: they were burning cash on untracked Instagram campaigns while celebrating fake efficiency gains. By the time it surfaced, the budget decisions made against that data were already locked in.
Weekly Sanity Checks
-
Sum of parts equals total (revenue by category = total revenue)
-
Ratios stay in bounds (CAC/LTV between 0.1 and 0.5)
-
Correlations hold roughly (traffic up should mean conversions up)
Monthly Deep Dives
-
Compare metric definitions to documentation
-
Verify all data sources are still connected
-
Check for new dimensional values not being captured
-
Audit who's actually using which metrics
Quarterly Reviews
-
Retire unused metrics
-
Refactor complex calculations
-
Update SLOs based on actual performance
-
Refresh ownership assignments
The quarterly review is the one most teams skip. That's usually when you discover metrics that haven't had an owner for six months.
The escalation playbook that saves relationships
When metrics break at 4 PM on a Friday, you need a clear escalation process that doesn't burn out your team or send executives into a panic.
Severity Levels
SEV1 — Business Critical: Revenue calculations wrong, customer-facing metrics broken, board report numbers incorrect. Response: immediate, all-hands.
SEV2 — Operational Impact: Planning metrics delayed, department dashboards incomplete, historical data needs restatement. Response: within 2 hours.
SEV3 — Quality Issues: Exploratory analysis affected, non-critical metrics wrong, future-dated calculations off. Response: next business day.
Communication Templates
Initial Alert (within 15 minutes): "We've detected an issue with [metric name]. Initial assessment shows [impact]. [Owner name] is investigating. Update in 30 minutes."
Status Update (every 30 minutes): "Update on [metric]: Root cause identified as [issue]. Fix in progress, estimated resolution [time]. [Specific impacts] affected."
Resolution Notice: "[Metric] issue resolved. Cause: [brief explanation]. Impact: [what was affected]. Data has been [corrected/marked unreliable]. Postmortem scheduled for [date]."
The communication cadence matters as much as the technical fix. Executives who don't hear anything for two hours assume the worst. Regular updates — even "still investigating, no resolution yet" — reduce the panic significantly.
Making it sustainable with the right tooling
Manual monitoring doesn't scale. But full automation without analyst input creates black boxes that nobody trusts. The sweet spot is analyst-configured, system-executed monitoring.
Modern BI platforms handle basic threshold alerts, but real analytics observability needs more. The monitoring should understand metric relationships, not just individual values. It should know that when payment processing delays, revenue metrics lag but aren't wrong. It should recognize seasonal patterns without constant threshold adjustments.
This is where AI-powered operational platforms can make a real difference. Instead of writing hundreds of alert rules, you define business relationships and let the system learn what normal looks like. When conversion rate drops, it automatically checks whether traffic sources changed, whether new products launched, whether payment methods failed — the same investigation tree analysts would manually work through anyway.
For teams already running data quality automation, adding metric-level observability is a natural extension. The same patterns that catch bad transaction data can validate aggregate metrics. You just need to add business context layers on top.
The implementation roadmap
Don't try to monitor everything at once. Here's the rollout that actually sticks:
Week 1–2: Foundation Identify your Tier 1 metrics (10–20 max), document current calculation logic, set up basic freshness monitoring, and create an ownership matrix for Tier 1 only.
Week 3–4: Critical Coverage Add business logic checks for Tier 1, build investigation runbooks for your top five metrics, test escalation paths with dry runs, and set up daily sanity check reviews.
Month 2: Expand and Refine Add Tier 2 metrics to monitoring, implement relationship checks, create a postmortem template and process, and tune alerts based on false positive rate.
Month 3: Operationalize Automate routine investigations, add proactive hunting queries, train the broader team on runbooks, and establish a monthly review rhythm.
Ongoing: Maintain and Improve Quarterly coverage audits, regular threshold tuning, retiring outdated metrics, updating ownership as the team changes.
The biggest mistake teams make is trying to build perfect observability before starting. Get basic monitoring on critical metrics first, then expand. A simple daily check on your top 10 metrics beats elaborate monitoring on hundreds that nobody actually reviews.
What this actually achieves
When analytics observability works, the panicked "are these numbers right?" meetings stop. Executives trust dashboards because issues get caught and communicated before they notice anything's wrong. Analysts spend time on analysis, not debugging.
More importantly, you build institutional memory about how metrics fail. The third time inventory calculations break the same way, you've got a documented fix ready. The fifth time conversion tracking has issues, you know exactly who to call. Problems that used to take days get resolved in hours.
The business impact compounds. Operations makes better decisions because metrics are trustworthy. Finance can version-control their metric definitions knowing changes won't silently break downstream reports. Planning cycles run smoother because data is ready when expected.
The real win is cultural, though. When analysts own observability for their metrics, they shift from reactive firefighting to proactive quality management. They become actual partners to the business instead of just report generators. That shift is worth more than any tool or framework.
Making it stick
Analytics observability fails when it's treated as a project instead of a practice. Tooling alone won't get you there.
Executive Support
Make it clear that metric quality is everyone's responsibility, not just an IT concern. When the CFO cares about data freshness SLOs, teams prioritize accordingly. When nobody senior cares, it quietly becomes a side project.
Resource Allocation
Someone needs to own the observability practice — not as a side project, but as a real responsibility with actual time allocated. It usually works best with a senior analyst who understands both the technical and business sides.
Cultural Change
Celebrate prevented incidents, not just resolved ones. When monitoring catches an issue before it impacts a decision, that's a win worth recognizing. Build habits around proactive quality checks rather than reactive fixes.
Continuous Improvement
Every incident reveals a monitoring gap. Every false alarm shows where thresholds need tuning. Every missed issue exposes a coverage hole. Use those lessons to evolve your observability practice, not just patch individual problems.
Companies that do this well treat analytics observability like any other operational capability. They invest in it, measure it, and improve it over time.
Bad metrics are as dangerous as bad products — and the best teams protect against both with the same level of seriousness.
Ready to elevate your business intelligence?
Join 2,500+ businesses leveraging Glasaly to drive smarter decisions, improve team alignment, and boost operational performance.