
That quarterly revenue metric your CFO relies on? Someone just edited the formula in production. Again. And nobody knows who changed it, what it looked like before, or why half the dashboard broke.
Business teams need version control for metric definitions just like engineering teams need it for code. But asking analysts to learn git commands and manage pull requests? That's not happening. What works is adapting the useful parts of version control - approval gates, staged rollouts, rollbacks - into workflows that business teams can actually use.
The metric definition mess that happens without version control
Picture a mid-sized ecommerce company. Marketing defines "customer acquisition cost" one way (paid ads only). Finance includes organic traffic costs. Product calculates it per cohort. Three different CAC metrics, all supposedly measuring the same thing, producing wildly different numbers.
Someone notices the discrepancy during a board meeting. The scramble begins. Who owns the real definition? Which dashboard has the right formula? When did these diverge?
Without version control for metric definitions, you get definition drift where small tweaks accumulate over months. Your "monthly recurring revenue" metric from January looks nothing like December's version, but nobody documented the changes. Breakage cascades happen when you change how you calculate customer lifetime value, and suddenly 14 downstream metrics show errors. No way to roll back. No way to test first.
Ownership confusion sets in. The original analyst left six months ago. Three people have edited the metric since. Nobody remembers why we exclude certain customer segments.
Then come the audit nightmares. The board asks why revenue reporting changed. You spend days reconstructing what the metric looked like three quarters ago from scattered emails and Slack messages.
Building a lightweight approval workflow
The solution isn't forcing business teams to learn software engineering practices. It's creating simple workflows that capture the benefits of version control using tools they already understand.
Stop missing critical business insights.
Glasaly helps you create, share, and track interactive dashboards effortlessly.
- Real-time data visualization
- Collaborative report sharing
- Customizable analytics widgets
No credit card required
Start with a basic approval gate system. Any metric that feeds into executive dashboards or financial reporting needs two approvals before changes go live. Not complex - just a simple rule that creates a pause before production changes.
-
Tier 1
Financial reporting, board metrics (CFO + data lead approval)
-
Tier 2
Department KPIs (department head approval)
-
Tier 3
Team metrics (team lead approval)
-
Tier 4
Experimental metrics (no approval needed)
Document changes in plain English. Create a simple template with what changed (the actual formula difference), why it changed (business reason), who requested it, what breaks if we're wrong, and how to reverse it.
Use spreadsheets for tracking. Forget specialized tools initially. A shared spreadsheet with columns for metric name, version number, change date, approver, and rollback instructions works fine for teams under 50 people.
Start with a shared spreadsheet template for change requests to keep approvals lightweight.
The accounting team at a logistics company implemented this using nothing but Google Sheets and email notifications. Metric calculation errors dropped by roughly 70% in four months. Not because the process was sophisticated - because it forced people to think before changing production metrics.
Staged rollouts that actually happen
Engineering teams test code changes in staging environments before production. Business metrics need the same concept, but simpler.
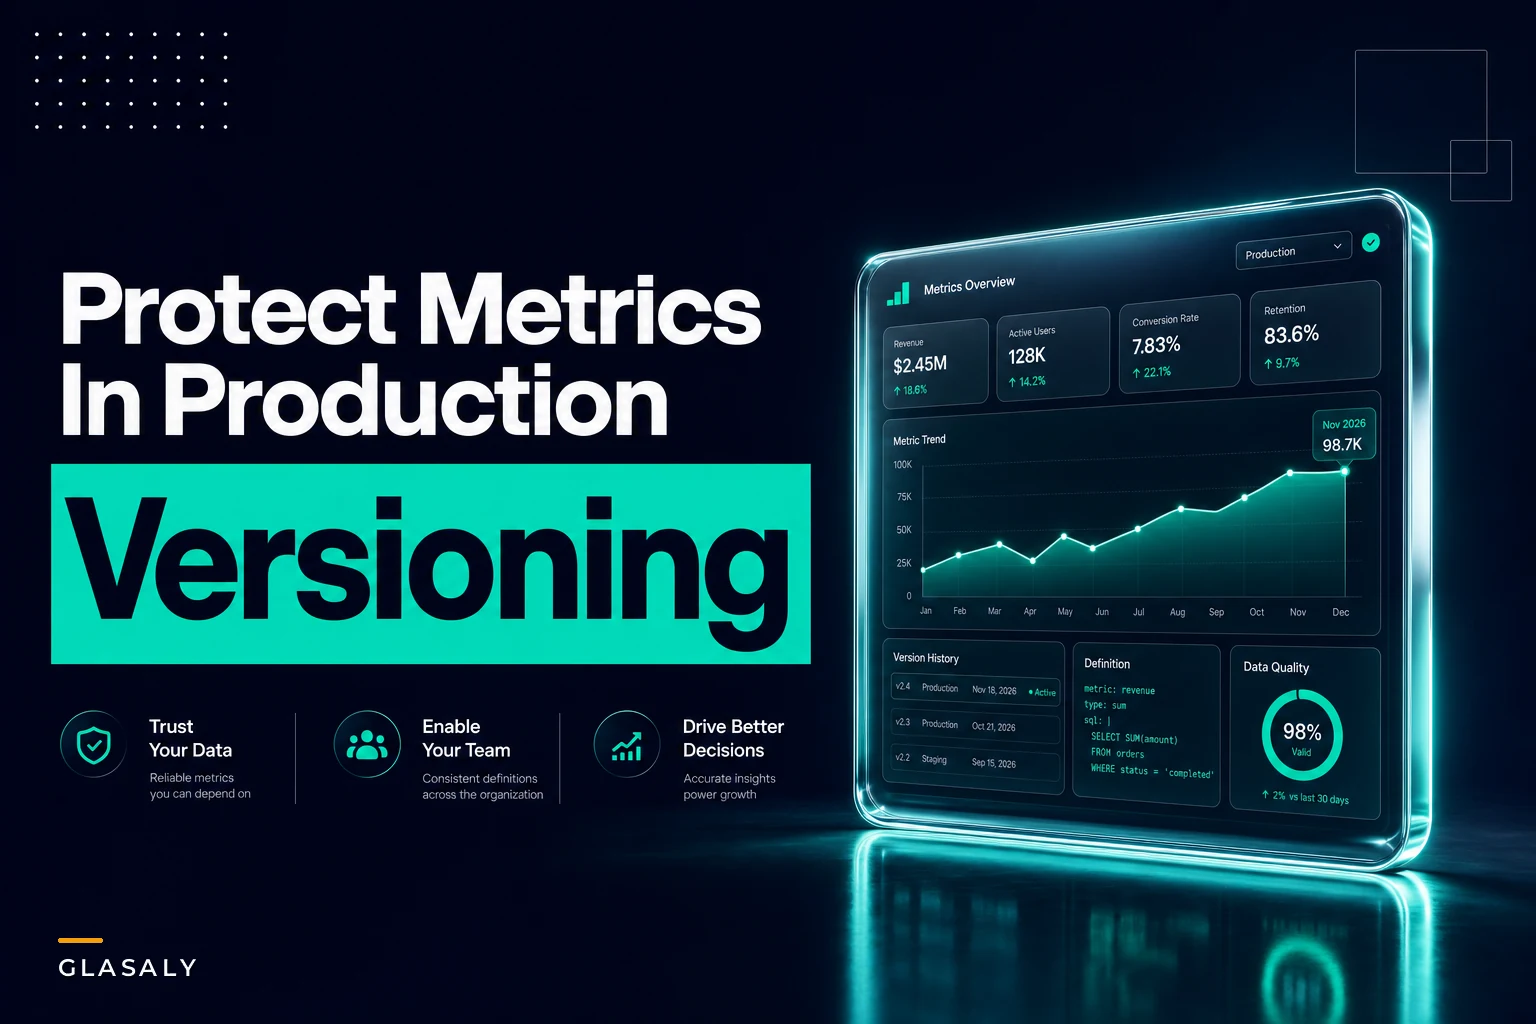
Instead of separate environments, use time-based staging. New metric definitions calculate in parallel with old ones for a defined period. Both numbers visible, clearly labeled. After the validation period, the old version archives automatically.
A retail analytics team implemented this for their inventory turnover metrics. New definition runs alongside the old for 2 weeks. Dashboard shows both as "Current" and "Proposed". Discrepancies trigger review meetings. After validation, "Proposed" becomes "Current". Old definition archives but stays queryable.
During their first staged rollout, they caught a calculation error that would have understated inventory costs by approximately $400k per quarter. The parallel run made the discrepancy obvious.
Key staging principles include running parallel, not sequential - both versions calculate simultaneously from the same data source. No "let's see what happens" deployments. Set clear transition dates: "This metric changes on the 1st of next month" not "sometime soon when we get around to it." Label everything explicitly. Users should immediately see which metric version they're viewing.
Real rollback procedures without the panic
When metrics break in production, the typical response is chaos. Analysts scrambling to fix formulas. Executives seeing wrong numbers. Dashboards showing errors.
Real rollback capability means any metric can revert to its previous definition within minutes, not hours of debugging.
The three-version rule
| Version Type | Status | Purpose |
|---|---|---|
| Current | Production | Active metric in use |
| Previous | Last stable | Immediate rollback target |
| Archive | Historical | Long-term reference |
If current breaks, previous becomes current immediately. No fixing forward during business hours.
Rollback triggers
-
Metric returns null for >10% of records
-
Value changes by >30% without explanation
-
Downstream metrics show cascade errors
-
Manual rollback request from metric owner
The actual rollback process: Flag metric as "unstable" (visual indicator on all dashboards), switch to previous version, notify metric owner and stakeholders, log the rollback with timestamp and trigger reason, create incident ticket for investigation.
A healthcare analytics team used this approach after a botched patient readmission rate calculation affected quality scores. The rollback took 3 minutes. The investigation and fix happened offline without production pressure. Previously, similar issues meant hours of executives seeing wrong data while analysts debugged live.
Who owns what: governance without committees
Version control only works when someone actually owns each metric. Not a committee. Not "the data team." A specific person who gets the alert when something breaks.
But metric ownership doesn't mean that person makes unilateral changes. It means they coordinate the change process.
Ownership responsibilities include maintaining documentation, approving or rejecting change requests, coordinating testing, handling rollback decisions, and reviewing downstream impacts.
Keep a simple registry with metric name, current owner, business stakeholder, technical formula, dependencies (upstream and downstream), change history, and rollback instructions.
Don't overcomplicate this. A well-structured spreadsheet beats a half-implemented tool every time.
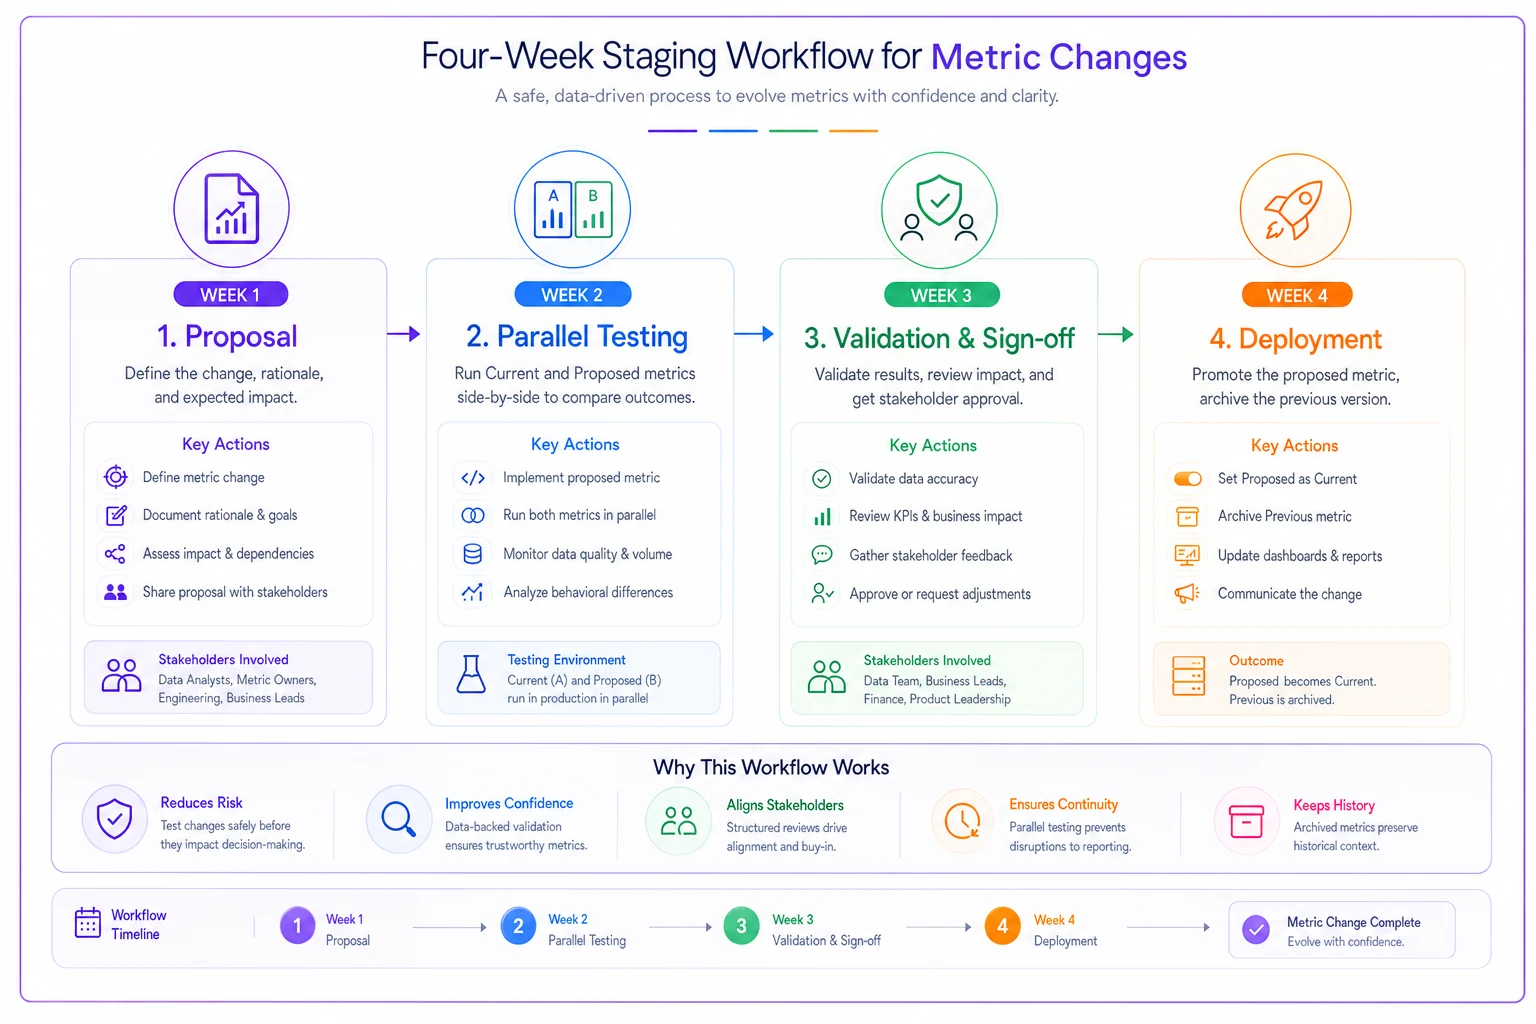
The staging workflow that works
The actual workflow that works for teams without heavy engineering resources:
-
Week 1
Proposal
- Requester documents the change, owner reviews impact analysis, stakeholders notified of upcoming change -
Week 2
Parallel testing
- New definition runs alongside current, daily comparison reports sent to stakeholders, discrepancies investigated and documented -
Week 3
Validation
- Stakeholders confirm new numbers make sense, downstream metrics checked for breaks, rollback plan confirmed -
Week 4
Deployment
- New becomes current, old becomes previous, documentation updated, monitoring activated
Here's a simple visual of the four-week staging workflow to share with stakeholders.
This seems slow compared to changing metrics instantly. But consider the alternative: spending two weeks explaining to the board why last quarter's numbers were wrong, then another month fixing all the broken downstream calculations.
Building the review process
The review process needs to be lightweight enough that people actually follow it, but thorough enough to catch problems.
Before any metric change, answer two questions:
-
What breaks if this is wrong?
-
How do we fix it if it breaks?
If you can't answer both clearly, the change isn't ready.
-
[ ] Formula change documented in plain English
-
[ ] Test calculations match expected results
-
[ ] Downstream metrics identified and tested
-
[ ] Rollback instructions written
-
[ ] Stakeholders notified
-
[ ] Parallel run period defined
Even without engineering resources, basic automation prevents most problems. Value range checks ensure revenue can't be negative. Null percentage monitoring triggers alerts when >5% nulls appear. Period-over-period variance alerts flag >25% changes without explanation. Dependency validation checks related metrics when primary metrics change.
Common patterns and anti-patterns
Patterns that work include the gradual rollout - start version control with just Tier 1 metrics, add others after the process proves itself. The buddy system gives every metric a primary owner and a backup who understands the definition. The changelog meeting is a weekly 15-minute standup where recent metric changes get announced.
Anti-patterns to avoid: The committee trap requires 5+ approvals for minor changes, so people start bypassing the process entirely. The perfect documentation quest waits to implement version control until all metrics are perfectly documented. The tool obsession spends months evaluating version control tools instead of starting with spreadsheets and email.
Making it sustainable
Version control for metrics fails when it becomes overhead that slows down legitimate business needs. The balance is creating enough structure to prevent chaos without creating bureaucracy.
Start small with 5-10 critical metrics, implement basic version tracking, add approval gates, then expand after proving value.
Automate the repetitive parts like change notifications, parallel calculation runs, discrepancy reports, and rollback triggers.
Keep the human parts human: plain English documentation, business context for changes, stakeholder communication, and impact assessment.
Tools and implementation
You don't need specialized software to start. Minimum viable toolset uses Google Sheets or Excel with version history enabled for tracking, email or Slack with clear approval templates for approvals, shared drive with folder structure by metric for documentation, and basic dashboard showing metric health status for monitoring.
As you scale, operational software platforms can automate much of this workflow. AI-powered platforms now handle metric versioning, automated testing, and rollback procedures without requiring engineering resources. The key is starting with manual processes that work, then automating the parts that become painful.
The real challenge isn't technical - it's behavioral. Teams need to accept that changing metrics requires process, just like changing financial records or customer data.
Moving forward
Implementing version control for metric definitions doesn't require becoming an engineering organization. It requires acknowledging that metrics are production systems that need basic change management.
Start with your most critical metrics. Implement simple approval gates. Create basic rollback procedures. Document changes in plain English. Run new definitions in parallel before switching over.
The investment is minimal - maybe a few hours setting up the initial process. The return is avoiding those painful moments when executives ask why numbers changed, and nobody can explain what happened or how to fix it.
Your metrics drive business decisions worth millions. They deserve the same careful handling as your production code, just adapted for the teams that actually manage them. The workflow doesn't need to be complex. It just needs to exist.
Ready to elevate your business intelligence?
Join 2,500+ businesses leveraging Glasaly to drive smarter decisions, improve team alignment, and boost operational performance.