


Most governance programs die quietly. Not from a dramatic failure, but from a budget review where someone asks "what did we actually get for this?" and the governance lead has nothing but policy documents and a catalog nobody opens. The work was real. The impact was invisible. And invisible impact doesn't survive a renewal conversation.
This is the gap analytics governance KPIs are supposed to close. Not vanity metrics like "number of governed datasets," but signals that connect governance activity to outcomes someone with a budget actually cares about—faster incident resolution, fewer broken dashboards, metrics people trust enough to act on.
The hard part isn't picking KPIs. It's instrumenting them so they're real, then wiring those signals into the decisions that fund your program. Below is how the measurement system fits together, where it tends to break, and how to build a scorecard that survives scrutiny.
Why governance programs can't prove their own value
Governance work is preventative. When it's working, nothing happens. No bad metric ships. No exec makes a decision on a broken dashboard. No analyst spends three days chasing a definition that was already documented somewhere.
Preventative work is brutal to measure because the counterfactual is invisible. You can't easily show the incident that didn't happen. So governance teams fall back on activity metrics—catalog entries written, policies published, review meetings held—which measure effort, not outcome. A reviewer sees those numbers and correctly senses they're being shown motion instead of results.
A predictable pattern shows up across data teams: governance gets funded on enthusiasm in year one, coasts on momentum in year two, and faces a skeptical budget review in year three where nobody can answer the ROI question. The telemetry was never built, so the case was never there.
The fix is to measure governance like any operational system—with signals that track how fast problems get detected and resolved, how much of the business the program actually covers, and whether people change their behavior because of it.
The four KPI families that actually matter
Forget the long list of possible metrics. Governance KPIs that connect to funding decisions cluster into four families. Each answers a different question a budget owner will ask.
Stop missing critical business insights.
Glasaly helps you create, share, and track interactive dashboards effortlessly.
- Real-time data visualization
- Collaborative report sharing
- Customizable analytics widgets
No credit card required
| KPI family | Question it answers | Core metrics | Why a funder cares |
|---|---|---|---|
| Detection & response | How fast do we catch and fix metric problems? | MTTI, MTTR for metrics | Downtime on trusted metrics = bad decisions |
| Coverage | How much of what matters is actually governed? | Catalog coverage, owned-metric %, lineage completeness | Ungoverned surface = unmanaged risk |
| Accountability | Do owners do their job on time? | Owner SLA compliance, review freshness | Governance without accountability is theater |
| Adoption | Do people use the governed layer? | Catalog usage, certified-metric query share | Unused governance is wasted spend |
The trap is reporting only one family. A program heavy on coverage metrics ("98% of datasets cataloged!") but blind to adoption is often governing a graveyard—thorough documentation nobody reads. One heavy on detection but light on accountability catches problems fast but has no mechanism to stop them from recurring.
MTTI and MTTR for metrics
Mean time to identify and mean time to resolve are borrowed from incident response, and they translate cleanly to metrics governance. MTTI is the clock from when a metric breaks—wrong number, stale data, definition drift—to when someone officially knows. MTTR is from identification to a trusted fix.
What makes these powerful is that they're trend lines, not snapshots. A governance program that's working should push MTTI down over quarters, because detection moves upstream from "an exec noticed the dashboard looked weird" to "a data-quality check fired before anyone saw it." That shift is your single most convincing evidence that governance is doing something.
A realistic example: before instrumentation, a mid-size data team was finding metric breaks when business users complained—MTTI measured in days, sometimes a full reporting cycle. After wiring detection into their checks and ownership flows, identification dropped to a few hours for the metrics that mattered. They didn't eliminate breaks. They caught them before the breaks turned into bad decisions, and that's the number worth showing.
Catalog coverage that means something
Raw catalog coverage—percent of datasets with an entry—is easy to game and mostly useless. A better version is weighted coverage: of the metrics and datasets that feed real decisions (exec dashboards, finance reports, customer-facing numbers), how many have an owner, a definition, and current lineage?
The distinction matters because coverage follows a brutal Pareto curve. Twenty percent of your assets drive roughly eighty percent of the decisions and risk. A program at 95% raw coverage can still be missing the handful of metrics that would cause a real problem if they broke. Score coverage against a tiered asset list, where tier-one assets count far more than the long tail. Building that tiered taxonomy is its own discipline—worth doing properly, as covered in the approach to an enforceable metric taxonomy.
Owner SLA compliance
Every governed asset should have an owner, and every owner should have obligations with deadlines: respond to a flagged issue within X hours, re-certify definitions quarterly, approve changes within a set window. SLA compliance is the percent of those obligations met on time.
This is the KPI that exposes whether your governance is real or decorative. In practice, owner SLA compliance usually degrades silently—someone changes teams, an owner inherits forty assets they never signed up for, review deadlines slip and nobody notices until an incident. Tracking compliance as a live number surfaces the decay before it becomes a crisis.
Instrumentation recipes: making the KPIs real
KPIs you calculate by hand once a quarter aren't KPIs, they're reports. The numbers need to come from systems automatically, or they rot. Here's how to instrument each family without a six-month engineering project.
MTTI/MTTR instrumentation. You need two timestamps per metric incident: when the problem began (or was detectable) and when it was resolved. Log every data-quality check result, every metric-validation failure, and every manually-filed metric issue into a single events table. MTTI is the gap between the earliest detectable failure and first acknowledgment. MTTR is acknowledgment to resolution.
-- metricincidents: one row per metric problem lifecycle event CREATE TABLE metricincidents ( incidentid STRING, metricid STRING, detectableat TIMESTAMP, -- when a check could have caught it identifiedat TIMESTAMP, -- when it was acknowledged resolvedat TIMESTAMP, -- when the fix was verified detectionsource STRING, -- 'automatedcheck' | 'userreport' | 'review' severity STRING -- 'tier1' | 'tier2' | 'tier3' );
SELECT DATETRUNC('month', identifiedat) AS month, severity, COUNT() AS incidents, ROUND(AVG(TIMESTAMPDIFF(identifiedat, detectableat, MINUTE))/60.0, 1) AS mttihours, ROUND(AVG(TIMESTAMPDIFF(resolvedat, identifiedat, MINUTE))/60.0, 1) AS mttrhours, ROUND(100.0 COUNTIF(detectionsource = 'automatedcheck') / COUNT(*), 0) AS pctautodetected FROM metricincidents WHERE resolvedat IS NOT NULL GROUP BY 1, 2 ORDER BY 1, 2;
That pctautodetected column is quietly the most important thing on the dashboard. When the share of problems caught by automated checks rises, your governance is moving detection upstream—the exact shift that drives MTTI down.
Coverage instrumentation. Maintain a canonical asset registry with a tier column, then left-join against your catalog's ownership and definition tables. Coverage is a join, not a survey.
WITH assets AS ( SELECT assetid, tier FROM assetregistry WHERE active = TRUE ) SELECT a.tier, COUNT() AS totalassets, COUNTIF(c.ownerid IS NOT NULL) AS owned, COUNTIF(c.definitionupdatedat >= DATESUB(CURRENTDATE(), INTERVAL 90 DAY)) AS freshdefinition, ROUND(100.0 COUNTIF(c.ownerid IS NOT NULL) / COUNT(*), 0) AS pctowned FROM assets a LEFT JOIN catalogmeta c ON a.assetid = c.assetid GROUP BY a.tier ORDER BY a.tier;
Owner SLA instrumentation. Log every owner obligation as a row with a due date and a completed date. Compliance is a date comparison. The one thing that keeps this honest is that obligations get created automatically—a quarterly re-certification obligation should spawn on a schedule, not when someone remembers.
Adoption instrumentation. Tag certified metrics in your semantic layer and parse query logs to measure what share of analytical queries hit the certified layer versus raw tables. Rising certified-query share means people are trusting and using the governed definitions instead of rolling their own.
Automate obligation creation (for example, quarterly re-certification) so SLA compliance reflects reality rather than memory.
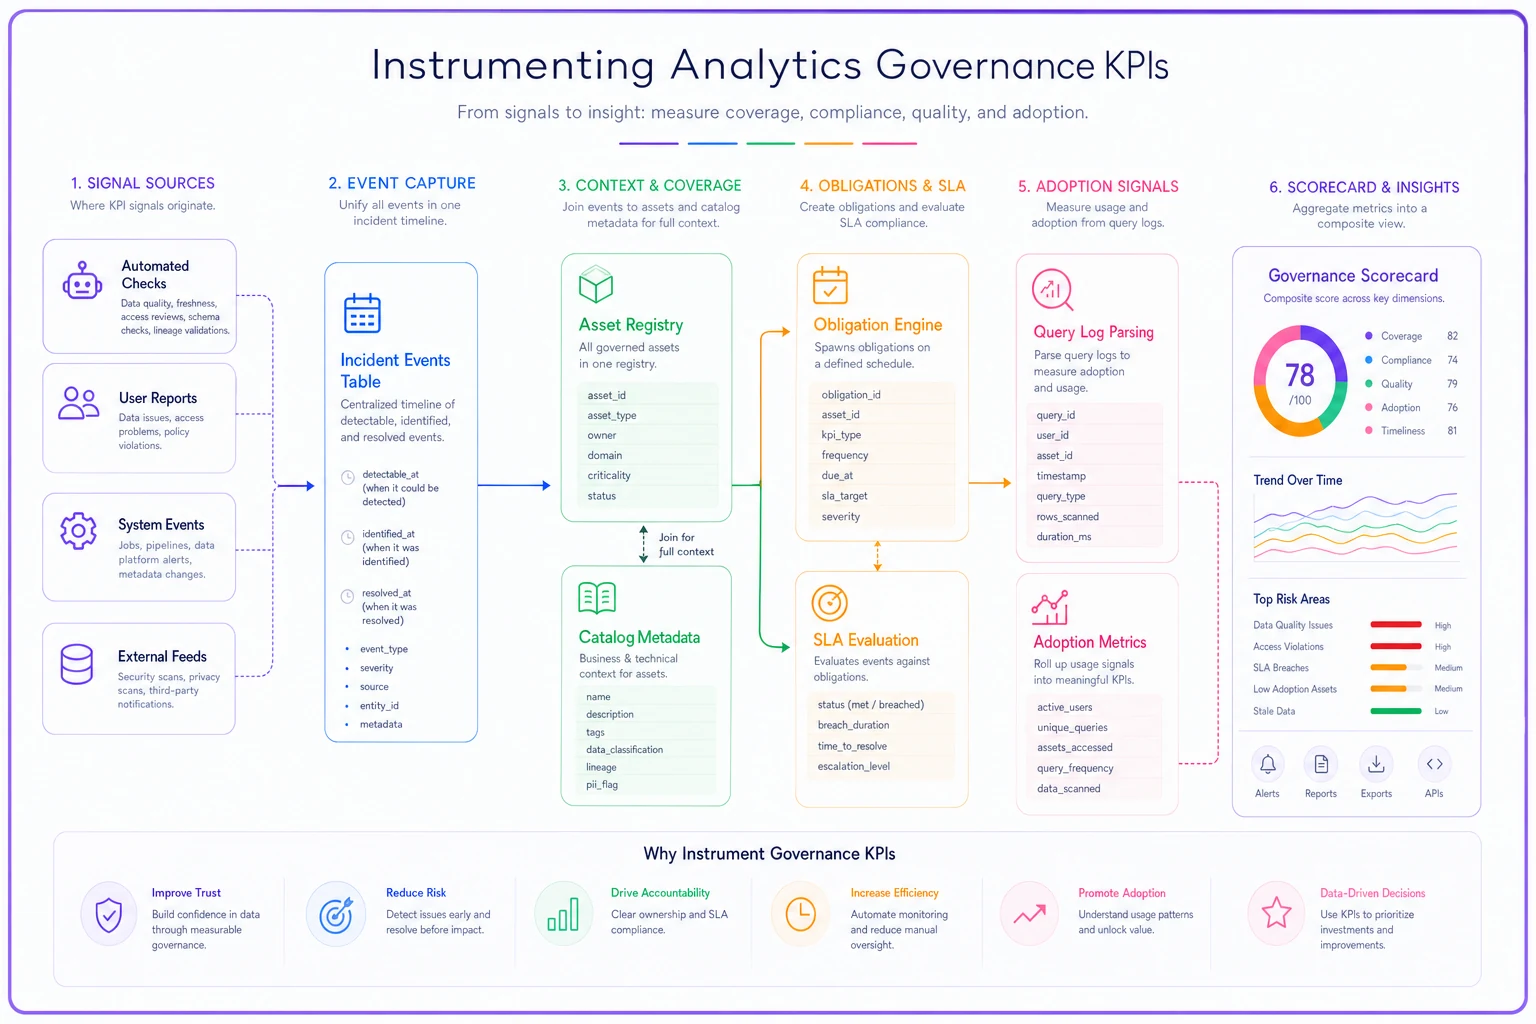
This diagram shows the main data flows from checks and logs into the events tables, registry joins, obligation rows, and the scorecard that feeds the dashboard.
Sample governance dashboard layout
A governance dashboard that a budget owner will actually read has four panels and no more. Each maps to a KPI family and shows a trend, not just a current value.
-
Reliability panel — MTTI and MTTR trend lines by severity, plus the auto-detection share. This is your headline. If it's improving, the rest supports it.
-
Coverage panel — tiered coverage as a stacked bar, with tier-one highlighted. A number next to it: "tier-one assets missing an owner" as a hard count, because zero is the only acceptable target there.
-
Accountability panel — owner SLA compliance over time, plus a short list of the owners or assets currently out of compliance. Naming the gaps is what gets them fixed.
-
Adoption panel — certified-query share and catalog active-user count. This is where governance proves it isn't a graveyard.
The mistake is building a twenty-widget dashboard that tries to show everything. Nobody reviews twenty widgets. Four panels with clear trends beat a wall of gauges every time, because the people deciding your funding spend thirty seconds on it, not thirty minutes.
The governance scorecard that ties to funding
Most programs skip this part, and it's the part that actually protects the budget. A scorecard rolls the four KPI families into a single composite that maps to a funding recommendation. It turns "here are some charts" into "here's the decision."
-
Reliability (30%) — MTTR trend, auto-detection share
-
Coverage (25%) — tier-one weighted coverage
-
Accountability (25%) — owner SLA compliance
-
Adoption (20%) — certified-query share, trend in active catalog users
Each family scores 0–100 against targets you set at the start of the period. The weighted composite maps to a recommendation band:
| Composite score | Signal | Funding recommendation |
|---|---|---|
| 80–100 | Program is compounding value | Renew, consider expanding scope |
| 60–79 | Working but with gaps | Renew flat, fix the weakest family |
| 40–59 | Activity without outcomes | Conditional renewal, 90-day remediation plan |
| Below 40 | Governance theater | Restructure or defund |
What makes this credible is setting the targets before the period, not reverse-engineering them to make the score look good. A scorecard you grade after the fact fools no one. The honesty of pre-committed targets is what gives the whole thing authority in a renewal conversation. If you're building the financial side of that case, it pairs naturally with a broader analytics funding model built on ROI scorecards.
A real scenario
A regional insurance brokerage—roughly 60 people, a two-person data team, no dedicated governance function—was drowning in metric distrust. The "active policies" number differed across three dashboards, and the leadership team had quietly stopped trusting any of them. Every monthly review burned the first twenty minutes arguing about which number was right.
They started small: a tiered asset list (about 40 tier-one metrics), an incident events table, and owner assignments with quarterly re-certification. No new platform, just instrumentation on top of what they already had.
The first quarter's scorecard was ugly—composite in the low 50s. MTTI for the core metrics was measured in days because nothing was being caught automatically, and owner SLA compliance sat around 55% because owners didn't know they were owners. But it was real, and it gave them a specific remediation list instead of a vague sense of dysfunction.
Two quarters later: auto-detection share went from near zero to a bit over half, MTTI on tier-one metrics dropped to under a day, and SLA compliance climbed past 80% once obligations were auto-generated and visible. The composite reached the mid-70s. The "active policies" argument stopped happening—not because they built something fancy, but because there was now one owned, certified definition and a dashboard showing it was healthy. When budget season came, the trend line in the reliability panel was the entire conversation.
When this level of measurement makes sense—and when it doesn't
When it's worth it: You have multiple teams consuming shared metrics, real money attached to decisions riding on those numbers, and a governance program that needs to justify its existence to a budget owner. Once there's more than one team and more than a handful of decision-grade metrics, the coordination cost of not measuring governance exceeds the cost of instrumenting it.
When it's overkill: A five-person startup with one analyst and a dozen metrics doesn't need MTTR trend lines and a weighted scorecard. The whole thing lives in one person's head, and formal governance telemetry just slows them down. Build the asset list, skip the scorecard.
Who should not do this yet: Teams that haven't solved basic catalog maintenance. If your catalog is already stale and nobody owns upkeep, adding a measurement layer on top produces honest numbers about a broken program—which isn't exactly useful. Fix the maintenance rituals first—the contributor incentives and lightweight processes that keep a catalog alive and trustworthy—then instrument. Measurement amplifies the state of what's underneath it; it doesn't fix a foundation that was never there.
The system view: how these pieces reinforce each other
The four KPI families aren't independent—they form a loop. Better detection surfaces which assets break most often, which tells you where coverage gaps actually hurt. Coverage with real owners makes SLA compliance measurable. SLA compliance keeps definitions fresh, which makes the certified layer trustworthy, which drives adoption. And adoption gives you the usage signal that tells you which assets deserve the most governance attention going forward.
Break any link and the system degrades predictably. Good detection with no ownership means problems get found but not fixed. Good coverage with no adoption means a thorough catalog nobody uses. The scorecard's job is to keep all four visible at once, so you notice the weak link before it quietly drains the value out of everything else.
That's the real argument for instrumenting governance properly. Not to generate charts, but to run the program as an operational system with feedback loops you can actually see. The programs that survive their third-year budget review aren't the ones that did the most governance work—they're the ones that could show the work connected to outcomes someone with a budget cared about. The telemetry is how you make that connection undeniable.
Ready to elevate your business intelligence?
Join 2,500+ businesses leveraging Glasaly to drive smarter decisions, improve team alignment, and boost operational performance.