



Most analytics teams don't get killed by bad work. They get killed by bad funding.
You've probably lived some version of this: the platform bill creeps up quarter over quarter, finance starts asking pointed questions, and suddenly the conversation isn't about which dashboards drive revenue—it's about why the warehouse costs more than the CRM. Nobody in the room can explain what the money bought. The analytics lead gets defensive. Finance gets suspicious. And the whole thing ends with an arbitrary 15% cut that lands on whatever project happened to be easiest to cancel.
The problem isn't that analytics is expensive. The problem is that most teams fund it like a cost center and defend it like a research lab. Neither framing survives contact with a CFO who wants to know the return on a $40k monthly spend.
This is a systems piece, not a tips piece. The goal is to walk through how an analytics funding model actually holds together—how tiers, chargebacks, ROI scorecards, and debt runway rules connect into something you can defend in a budget meeting. And where it usually breaks as the team scales past its first few analysts.
Why analytics funding breaks in the first place
The core issue is that analytics spend is shared but the value is local. The warehouse serves everyone. The bill lands in one place. When ten teams benefit from a data platform but only one team's budget shows the cost, you get a predictable set of behaviors:
-
Teams treat queries as free because they don't see the bill
-
Nobody prioritizes cleanup because cleanup has no owner
-
The platform team becomes the villain every budget cycle
-
Genuinely valuable projects get cut alongside genuinely wasteful ones, because there's no way to tell them apart
This usually surfaces around the time a company crosses 50-ish people. Before that, one person mostly knows what everything costs and why. After that, the knowledge fragments. Finance sees a line item growing 8–12% a quarter with no story attached to it.
What tends to happen in these situations is that the money conversation gets emotional precisely because it's under-instrumented. When you can't measure it, you argue about it. A funding model exists to move the conversation from feelings about cost to facts about value and consumption.
Governance and cost control are the foundation here—if you haven't already put basic guardrails in place, the funding model will just be accounting on top of chaos. It's worth reading up on governance policies and low-effort controls for query and storage spend before you try to build tiers on top, because you can't allocate costs you can't attribute.
The four pieces that make a funding model work
A working funding model isn't one thing. It's four things that reference each other. Miss one and the others get shaky.
Stop missing critical business insights.
Glasaly helps you create, share, and track interactive dashboards effortlessly.
- Real-time data visualization
- Collaborative report sharing
- Customizable analytics widgets
No credit card required
| Component | What it answers | Who it's for | What breaks without it |
|---|---|---|---|
| SLA-backed funding tiers | "What service level does this money buy?" | Consuming teams | Everyone expects gold-tier reliability on free-tier budget |
| Chargeback / showback | "Who consumed what?" | Finance + consuming teams | Costs feel like weather—unpredictable and nobody's fault |
| ROI scorecards | "Is this feature worth more than its upkeep?" | Leadership | Old projects never die, new ones never get funded |
| Debt runway rules | "How much broken can we afford before we stall?" | Analytics leadership | Debt compounds silently until the team can't ship |
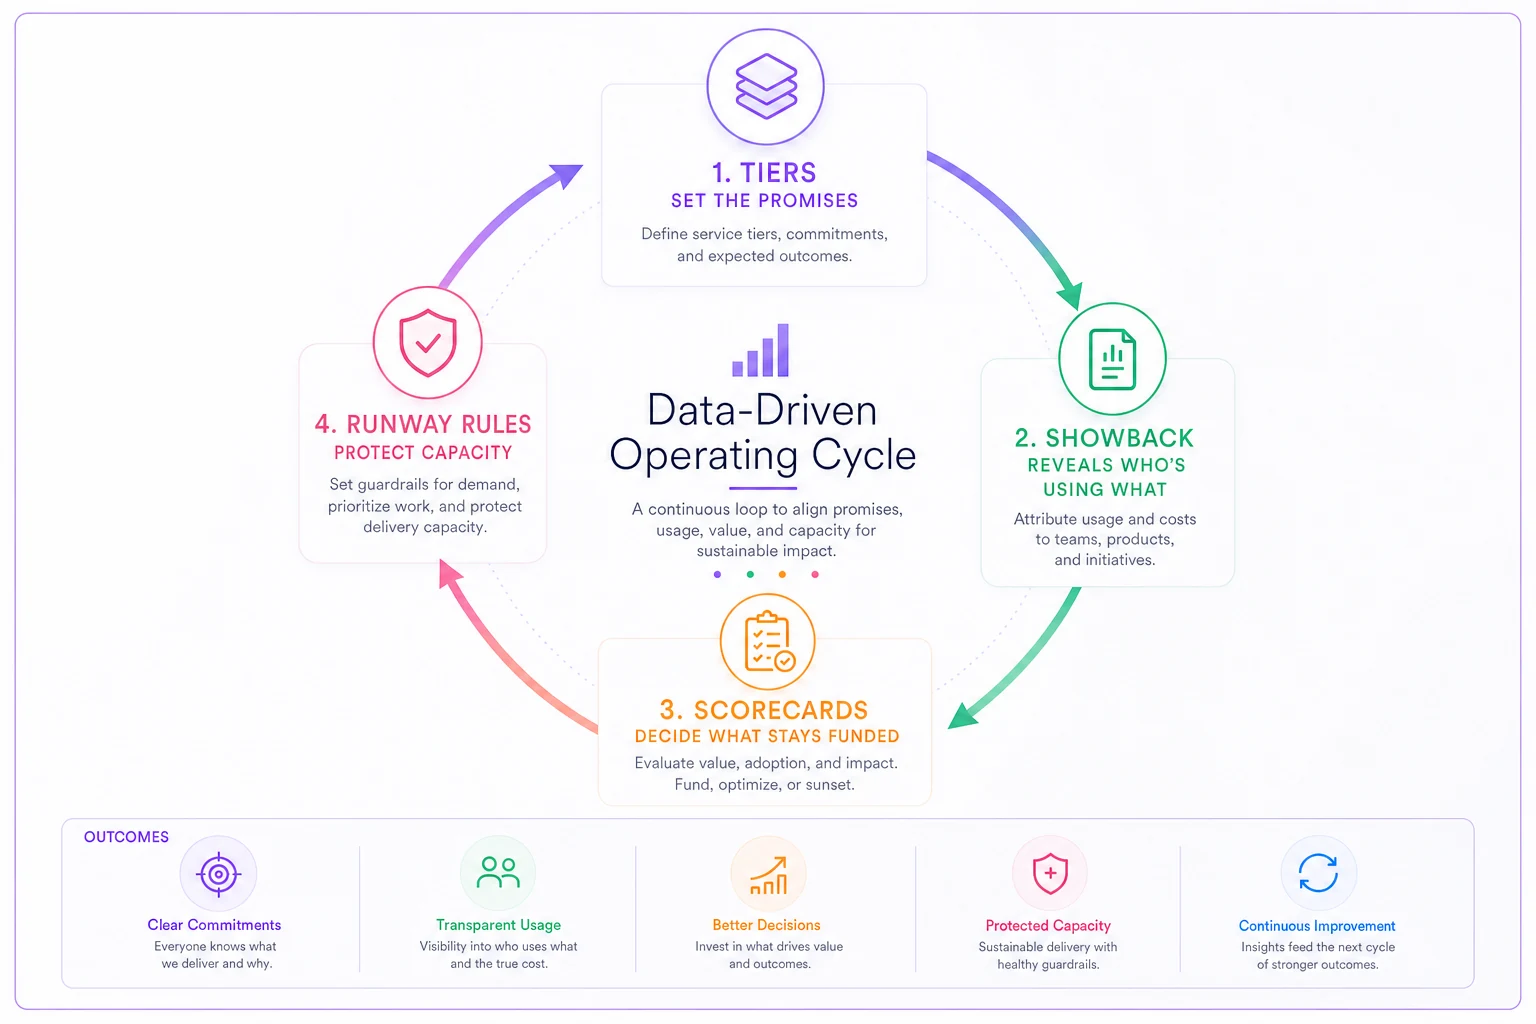
The reason this works as a system: tiers set expectations, chargeback/showback creates accountability, scorecards decide what lives and dies, and runway rules protect capacity. Each one covers a gap the others leave open.
SLA-backed funding tiers: stop selling one service level to everyone
Almost every team makes this mistake early: they offer the same reliability to every dataset and dashboard, funded from one pool. Then someone's month-end board deck breaks at the same time as a low-priority marketing experiment, and both feel like "the analytics team is on fire."
Tiers fix this by tying money to a promise. Instead of "we support all your data," you offer something closer to:
-
Tier 1 (Critical) Freshness within an hour, on-call coverage, incident response under 30 minutes, parity tests before every deploy. Funded centrally because these feed financials, exec reporting, and anything regulatory.
-
Tier 2 (Operational) Daily freshness, business-hours support, monitored but not paged. Funded partly by the consuming team.
-
Tier 3 (Best-effort) No freshness guarantee, no support SLA, may break during migrations. Basically free, but you accept the risk.
The insight most people miss: tiers aren't about restricting access, they're about pricing risk. When a sales ops manager asks for their dashboard to be "always up," the tier system lets you answer, "That's Tier 1—here's what it costs to maintain. Do you want to fund that or run it Tier 2?" Nine times out of ten they pick Tier 2 the moment there's a real number attached. Demand for gold-tier reliability evaporates when it stops being free.
If you're small (under ~50 people) skip formal tiers; they're overhead until multiple teams and owners exist.
When tiering makes sense—and when it doesn't
Tiering is worth it once you have more than a handful of consuming teams and more than one person maintaining the platform. Below that, it's overhead. If you're a two-person data team at a 30-person company, skip the formal tiers and just keep a list of what's critical.
It's also a bad idea when your data quality is so unstable that even "Tier 1" can't be honored. Promising a one-hour freshness SLA on a pipeline that fails twice a week just manufactures broken promises. Fix the reliability first, then sell the tier.
Chargeback vs. showback: pick the one your culture can survive
This is where funding models go to die. Teams get excited about chargeback—actually billing internal teams for their consumption—and then discover it triggers a political war. People start optimizing to avoid the bill instead of optimizing for the business. You get teams refusing to run useful analysis because it "costs them."
There's a gentler version: showback. Same measurement, no invoice. You show each team what they consumed, but the cost stays central. Most organizations should start here.
Start with showback; visibility often changes behavior without triggering budget fights.
Showback works when you want behavior change without budget warfare. Just seeing "your team ran $6,400 in queries last month, 70% of it from three unscheduled full-table scans" tends to change behavior on its own. Nobody wants to be the team on the wasteful end of that report.
Chargeback works when teams have real P&L ownership and leadership actually wants consumption to influence budgets. It's powerful but requires maturity. Do it too early and you'll spend more on internal accounting than you save.
-
Team name and total consumption (compute + storage, converted to dollars)
-
Top 5 cost drivers (specific queries, dashboards, or pipelines)
-
Month-over-month change with a one-line "why"
-
Tier breakdown — how much of their spend is Tier 1 vs. best-effort
-
One flagged inefficiency with a suggested fix and rough savings
That last line is what makes people actually read it. A report that only shows cost gets ignored. A report that says "you could save roughly $2k/month by scheduling this one job differently" gets forwarded.
A typical example: a mid-sized ops team was running a "live" dashboard that re-queried the full order history every time someone opened it—around 400 times a day. Nobody knew, because nobody saw the cost. The showback report surfaced it, the fix was a materialized view refreshed hourly, and the monthly bill for that one dashboard dropped from roughly $3,800 to under $500. No governance policy caught it. Visibility did.
ROI scorecards: comparing what a feature earns vs. what it costs to keep alive
Every analytics team accumulates a graveyard of dashboards and pipelines that were valuable once and are now just maintenance tax. The scorecard is how you decide what to keep funding.
The trap here is comparing features on build cost. Build cost is sunk. The number that matters is ongoing value vs. ongoing maintenance. A dashboard that took two weeks to build but drives a weekly pricing decision is cheap to keep. A dashboard that took two days to build but breaks every month and nobody's opened in a quarter is expensive, no matter how little it cost originally.
A workable scorecard scores each analytics asset on:
-
Decision impact Does an actual decision change based on this? (High / Medium / None)
-
Usage Real query/view counts over the last 90 days, not vanity opens
-
Maintenance load Hours per month spent keeping it alive—incidents, fixes, backfills
-
Freshness sensitivity How badly does stale data hurt? This maps back to which tier it belongs in
-
Replacement cost Could this be folded into an existing asset?
Score each, then plot maintenance load against decision impact. Anything high-maintenance and low-impact is a candidate for retirement or downgrade. This is roughly the same muscle as deciding which data problems to fix first using an impact-scoring matrix—you're forcing a comparison between effort and value instead of treating everything as equally worth keeping.
Worth sitting with: most teams have never once retired a dashboard. They only add. The scorecard's real job isn't picking winners—it's giving you permission and evidence to kill things. Retirement is the single most underused lever in analytics cost control, and it's almost always blocked by the fact that nobody wants to say "this isn't worth it" without data to back them up.
Runway rules for analytics technical debt
This is the part almost nobody formalizes, and it's the part that quietly determines whether your team is still shipping in two years.
Analytics debt compounds like financial debt. Every unfixed pipeline, every undocumented metric, every "temporary" workaround borrows against future capacity. The interest is the time your team spends firefighting instead of building. Left unmanaged, a team can hit a point where 60–70% of its capacity goes to keeping the lights on. That's when velocity dies and nobody can quite explain why the team that shipped so much last year suddenly ships nothing.
Runway rules are simple guardrails that keep debt inside a budget:
-
Cap maintenance at a fixed percentage of capacity. A common line is 30%. When firefighting exceeds it two months running, that's a signal to stop taking new work and pay down debt.
-
Assign every Tier 1 asset an owner. Unowned critical assets are debt with no repayment plan.
-
Set a "debt ceiling" per pipeline. After N incidents in a quarter, the pipeline gets rebuilt instead of patched again. Patching a chronically failing job is the analytics equivalent of paying only the minimum on a credit card.
-
Reserve recurring paydown time. One week a quarter, or a standing 20% of each sprint, dedicated to cleanup. If it's not scheduled, it doesn't happen.
The mistake teams make is treating debt paydown as something you do "when things calm down." Things never calm down. Debt work has to be budgeted, the same as features—which is exactly why it belongs inside the funding model and not in someone's good intentions.
A short real scenario
A B2B services company, roughly 120 employees, had a five-person data team and an analytics platform bill drifting toward $45k a month. Finance had frozen new hires until someone could justify the spend. The team couldn't—not because the work was bad, but because there was no framing for it.
They put in a lightweight version of everything above over about a quarter. Showback reports first—no chargeback, their culture wasn't ready for invoices. Then three tiers, with only around a dozen assets classified as Tier 1. Then a scorecard pass that retired 14 dashboards nobody had opened in months.
The results weren't dramatic in a headline way, but they were the right kind of boring. The monthly bill came down to somewhere around $34k–$36k, mostly from retirement and a few showback-driven query fixes. More importantly, the budget conversation changed completely. Instead of "why is this so expensive," finance was looking at a report that showed which teams consumed what, which assets drove decisions, and what the maintenance-to-feature ratio looked like. The hiring freeze lifted the next quarter—not because they cut costs, but because they could finally show the money was doing something.
The lesson wasn't "spend less." It was "make the spend legible."
How the pieces reinforce each other over time
Individually, none of these components is magic. A tier system without showback is just a spreadsheet nobody honors. Showback without scorecards tells you what things cost but not whether they're worth it. Scorecards without runway rules let you make good decisions that immediately get buried under new debt.
Here's a simple workflow visualization of how the pieces loop back on each other.
``
Tiers set the promises
       ↓
Showback reveals who's using what
       ↓
Scorecards decide what stays funded
       ↓
Runway rules protect the capacity to deliver on those tiers
       ↓
(back to Tiers)
``
The loop tightens as you grow. At 50 people, you can run most of this on spreadsheets and shared discipline. At 200, you'll need actual cost-attribution tooling and someone whose job partly includes running the model. The framework doesn't change—only the rigor does.
Where teams should start
If all of this feels like a lot, don't try to install it at once. The sequencing matters more than the completeness.
-
Start with attribution. You can't fund what you can't measure. Get consumption tied to teams before anything else.
-
Run showback for one quarter. No invoices. Just visibility. Let behavior change on its own first.
-
Classify your Tier 1 assets. Usually a dozen or fewer. Protect those, formalize their SLAs.
-
Do one scorecard pass and actually retire something. The first retirement is the hardest; after that it's a habit.
-
Set a maintenance cap and a paydown cadence. Even a rough 30% line changes how you plan.
The teams that survive budget scrutiny aren't the cheapest ones. They're the ones who can walk into a finance meeting and explain, line by line, what the money buys and why it's worth more than it costs. A funding model is just the machinery that lets you tell that story with numbers instead of arguments—which, when the budget cycle comes around, is the only version anyone actually believes.
The teams that survive budget scrutiny aren't the cheapest ones. They're the ones who can walk into a finance meeting and explain, line by line, what the money buys and why it's worth more than it costs. A funding model is just the machinery that lets you tell that story with numbers instead of arguments—which, when the budget cycle comes around, is the only version anyone actually believes.
Ready to elevate your business intelligence?
Join 2,500+ businesses leveraging Glasaly to drive smarter decisions, improve team alignment, and boost operational performance.