
Your CFO pulls up the cloud bill. Analytics costs jumped 47% last quarter. Nobody can explain exactly why. The data team points to increased usage from sales. Sales says they're running the same reports they always have. Engineering mentions something about materialized views getting refreshed too often. Meanwhile, that experimental dashboard someone built three months ago is still querying the entire customer history every hour, burning through $800 a week.
This is analytics cost governance in most organizations—reactive, fragmented, and always discovered too late.
The problem runs deeper than surprise bills. When analytics costs spiral without clear ownership, teams start making bad tradeoffs. They skip important analyses to stay under budget. They hoard compute resources "just in case." Or they build shadow systems that create even bigger problems down the road.
Why analytics costs explode when nobody's watching
Analytics spending is different from other operational costs because it's invisible until the damage is done. A factory manager sees inventory piling up. A retail manager notices overstaffing on slow days. But analytics waste happens silently—queries running against full datasets when samples would work, dashboards refreshing every minute when daily would suffice, temporary tables nobody remembers creating sitting there accumulating storage costs.
The core challenge is that analytics infrastructure was designed for flexibility, not cost control. Modern data platforms make it trivially easy to spin up resources, run massive queries, and store everything forever. The same power that lets an analyst quickly answer a critical business question also lets them accidentally burn through the monthly budget with a poorly written JOIN.
Most companies hit this problem around the same growth stage. When you're small, analytics costs are negligible—maybe $500 to $2,000 monthly across basic reporting tools. But somewhere between 50 and 200 employees, usage explodes. Marketing is running attribution models, product is analyzing user behavior, operations is tracking fulfillment metrics, and finance is building forecasting models. Each team thinks they're being reasonable. Collectively they're running up $15,000 to $40,000 monthly bills with no clear accountability.
The typical response makes things worse. Leadership demands a 30% cost reduction. The data team starts blocking queries, limiting access, creating approval processes that slow everyone down. Business users get frustrated and find workarounds—downloading data to Excel, building departmental databases, signing up for their own analytics tools. Six months later, costs are higher than before, now spread across multiple systems with duplicated data and inconsistent metrics.
The hidden multiplier effect of unmanaged analytics
What makes analytics cost governance particularly tricky is how costs compound across multiple dimensions. It's not just compute time or storage space—it's the interaction between query patterns, data freshness requirements, and user behavior that drives exponential growth.
Stop missing critical business insights.
Glasaly helps you create, share, and track interactive dashboards effortlessly.
- Real-time data visualization
- Collaborative report sharing
- Customizable analytics widgets
No credit card required
Consider a typical customer analytics dashboard. Marketing wants hourly updates to track campaign performance. So the dashboard refreshes 24 times daily, each time scanning three years of transaction history. But only two people actually check it regularly, and they only care about the last 30 days. The same data gets queried by five other dashboards because nobody knows this one exists. Finance built their own version with slightly different metrics. Customer success has another variant that includes support tickets.
Each dashboard seems reasonable on its own. Together they're running essentially the same expensive queries hundreds of times daily, scanning billions of rows to produce reports that get viewed maybe once a week. One retail analytics team was spending around $4,000 monthly on variations of the same customer lifetime value calculation, spread across 12 different dashboards and scheduled reports.
The freshness trap catches even experienced teams. A dashboard that genuinely needs real-time data for operational decisions gets built. Then other dashboards copy its refresh schedule because "real-time is better." Soon you're paying real-time prices for reports that support monthly planning decisions. A logistics company was refreshing inventory forecasts every 15 minutes at a cost of $6,000 monthly—but the operations team only reviewed them during a weekly Wednesday meeting.
Storage creep operates differently but causes equal damage. Temporary tables from one-off analyses become permanent. Backup copies of datasets proliferate "just in case." Development and staging environments mirror production data at full fidelity. That 10GB customer table becomes 10TB when you factor in all its copies, variants, and historical snapshots across environments.
Building governance that analysts will actually follow
The worst analytics governance programs fail because they try to control costs through pure restriction. Approval chains for new queries. Hard limits on compute time. Mandatory query review boards. These approaches create a police state that everyone learns to work around.
Effective governance works differently. It makes the cheap path the easy path. It provides visibility without creating bottlenecks. And it aligns incentives so teams naturally make cost-conscious decisions without constant oversight.
Start with consumption transparency. Most analysts have no idea what their queries actually cost. They write SQL focused on getting the right answer, not on optimizing resource usage. A simple change: add cost estimates to query interfaces. When someone writes SELECT * FROM events WHERE date > '2020-01-01', show them: "This query will scan 8.2TB and cost approximately $41. Consider adding partition filters or using the events_sample table for exploration."
This visibility alone typically reduces costs by 20-30% in the first month. Not because anyone mandates it, but because analysts start noticing wasteful patterns. They realize that exploratory query could use a 1% sample. They remember to add partition filters. They discover they've been joining enormous tables when a pre-aggregated version exists.
The next layer is smart defaults. Instead of letting analysts query production tables directly, create cost-optimized views that become the default starting point. A customersrecent view with just the last 90 days. A transactionsdaily aggregate for reports that don't need transaction-level detail. An events_sample table for exploration and development.
These aren't restrictions—analysts can still access full datasets when needed. But the convenient option becomes the efficient option. One analytics team reduced their monthly compute costs by roughly 40% just by making sampled tables the default in their SQL interface, requiring one extra click to query production data.
The chargeback decision: budgets versus showbacks
Every growing analytics organization eventually faces this: should departments pay for their analytics usage from their own budgets, or should it stay a centralized cost?
Full chargeback seems logical. Marketing pays for the campaigns they run, so why not the analytics to measure them? But in practice, strict chargeback models create perverse incentives. Teams start hoarding data, refusing to share datasets that might benefit others. They avoid exploratory analysis that might not yield immediate value. Worse, they make build-versus-buy decisions based on how costs appear on their budget rather than total organizational efficiency.
Chargeback models can quietly destroy analytics collaboration. The sales team stops sharing pipeline data because they don't want to pay for other departments' queries against it. Product teams build duplicate event tracking to avoid depending on engineering's data and budget. Finance creates shadow databases to avoid negotiating access and cost allocation.
Showback models work better for most organizations. Teams see their consumption, understand the costs, but don't directly pay from their budgets. This creates awareness without the territorial behavior. Monthly reports show each department their analytics spending. Quarterly reviews discuss optimization opportunities. The actual costs stay centralized, preserving the collaborative nature of organizational analytics.
The key is making showback consequential without being punitive. One approach that works: analytics budgets become part of departmental planning discussions. If marketing's analytics costs are growing 20% quarter-over-quarter, they need to explain why and show the value being generated. But they're not penalized for running important analyses or exploring new opportunities.
Some organizations use a hybrid model. Baseline analytics—standard reports, operational dashboards, shared datasets—stays centralized. Special projects get charged back. If marketing wants to build a complex attribution model requiring dedicated resources, that comes from their budget. This preserves day-to-day collaboration while creating accountability for major investments.
Policy templates that balance performance with cost
The most practical governance policies focus on specific tradeoffs rather than abstract limits. Instead of saying "reduce query costs," define when real-time data is worth the premium and when batch processing makes sense.
Here's a freshness policy framework that actually works:
Real-time (updates within 5 minutes): Reserved for operational dashboards directly driving immediate decisions—inventory allocation, fraud detection, system monitoring. Requires VP approval and quarterly value review. Typical cost: 10-15x batch processing.
Near real-time (updates hourly): For tactical dashboards supporting same-day decisions—campaign performance, sales pipeline, customer service queues. Requires manager approval and monthly usage review. Typical cost: 3-5x batch processing.
Daily refresh (updates overnight): Default for all analytical dashboards, reports, and metrics. No approval required. Covers the vast majority of business intelligence use cases. Baseline cost.
Weekly/Monthly refresh: For strategic planning dashboards, historical analyses, and compliance reporting. Encouraged for any report viewed less than daily. Cost savings: 70-90% versus daily refresh.
The power comes from making these tradeoffs explicit and tying them to specific use cases. A dashboard showing real-time website traffic for the operations team makes sense. The same real-time requirement for a quarterly business review deck doesn't.
Query complexity policies work similarly:
Interactive queries (results in <10 seconds): Limited to 30 days of data or pre-aggregated tables. For exploration and ad-hoc analysis.
Standard queries (results in <5 minutes): Up to 1 year of detailed data. For regular reporting and structured analysis.
Heavy queries (results in >5 minutes): Require scheduling during off-peak hours. Full historical access. For quarterly analyses and model training.
Experimental queries: Run against sampled data first. Only promote to full datasets after validation.
These aren't hard technical limits—they're guidelines that shape behavior. When analysts know that queries over 5 minutes get queued for overnight processing, they naturally start optimizing to fit within the interactive window.
Low-effort guardrails that prevent accidents
The most expensive analytics mistakes aren't malicious—they're accidental. Someone forgets a WHERE clause and scans a petabyte. A dashboard gets cloned with its refresh schedule, doubling costs overnight. A temporary table keeps growing until it consumes terabytes.
Smart guardrails prevent these accidents without creating friction for legitimate work. The key is catching problems early and making fixes easy.
Implement query cost estimation before execution. When someone submits a query estimated to cost over $50, require confirmation: "This query will scan approximately 5.4TB and cost $270. Are you sure you want to proceed?" Add a helpful suggestion: "Consider adding date filters or using the sampled table for initial exploration."
Set up automated circuit breakers for runaway processes. If a scheduled job suddenly costs 5x its normal amount, pause it and alert the owner. If a user's queries exceed $500 in a single day, temporarily require approval for anything additional. These aren't punishments—they're safety nets that catch problems before they compound.
Monitor for orphaned resources. Every week, automatically identify resources that are running up costs without delivering value. One company found over $12,000 in monthly savings just from turning off dashboards nobody had viewed in months but were still refreshing hourly.
Here are the main categories worth flagging in that weekly sweep:
-
Dashboards that haven't been viewed in 30 days but are still refreshing
-
Tables being updated but never queried
-
Scheduled queries running for users who left the company
-
Development datasets over 90 days old
Schedule automated weekly sweeps to identify dashboards and tables that haven't been used in 30 days—it's an easy source of quick savings.
Create smart retention policies that clean up automatically. Temporary tables older than 7 days get deleted unless explicitly preserved. Query results expire after 24 hours. Development environments reset monthly. Make preservation the exception, not the default.
The enforcement gradient: from nudges to hard stops
Governance enforcement should escalate gradually. Start with information, move to friction, and only use hard stops when absolutely necessary.
| Level | Approach | Typical Tools | Cost Impact |
|---|---|---|---|
| Level 1 – Information | Show costs in real-time, send weekly reports, flag expensive queries | Query UI cost hints, usage emails | 15–25% reduction |
| Level 2 – Friction | Confirm expensive operations, approval for new scheduled queries, concurrent query limits | Confirmation dialogs, lightweight approvals | Reduces wasteful patterns |
| Level 3 – Soft limits | Default quotas with approval to exceed, peak-hour throttling, off-peak queuing | Quota policies, scheduling rules | Encourages efficiency without blocking work |
| Level 4 – Hard limits | Block destabilizing queries, suspend repeat violators, auto-terminate runaway processes | System-level blocks, account suspension | Reserved for serious violations |
Most governance happens at levels 1 and 2. If you're constantly hitting level 4, the problem isn't enforcement—it's that your policies don't match operational reality.
The escalation path matters too. A new analyst running expensive queries gets education and guidance. A senior analyst who should know better gets stricter limits faster. A dashboard that suddenly starts consuming 10x normal resources triggers immediate investigation, not gradual escalation.
Practical cost allocation for mixed workloads
Real analytics environments don't fit neatly into categories. The same infrastructure supports exploratory analysis, production reporting, machine learning experiments, and ad-hoc investigations. Allocating costs fairly requires practical compromises.
Start by separating baseline from incremental costs. Baseline includes core infrastructure, standard reports, and shared datasets—costs you'd incur regardless of additional usage. Incremental covers anything beyond that baseline: special projects, additional processing, extended retention.
For baseline costs, use simple allocation by headcount or revenue. If marketing is 20% of company headcount, they bear 20% of baseline analytics costs. This avoids complex usage tracking for standard operations while still creating departmental awareness.
Incremental costs need more precision. Track them at the project level, not the query level. When marketing launches a new attribution model requiring daily reprocessing of three years of data, that's an incremental project with clear costs and owners. Don't try to allocate every single query—the tracking overhead exceeds the governance value.
Machine learning workloads complicate things further. Model training might consume massive resources periodically but deliver ongoing value. Instead of charging for peak usage, amortize training costs over the model's expected lifetime. A model that costs $5,000 to train but runs for six months gets allocated at roughly $800 monthly, not as a $5,000 spike.
Development and testing need special handling. Charging full price for development queries encourages production debugging, which is dangerous. Provide development quotas—maybe 10% of production resources—as part of baseline costs. Anything beyond that becomes an incremental project requiring justification.
The goal isn't perfect accounting accuracy. It's creating enough visibility and accountability that teams make reasonable tradeoffs without excessive bureaucracy.
When governance programs fail
Most analytics governance initiatives fail for predictable reasons.
The most common failure is the "big bang" implementation. Leadership sees a huge cloud bill, demands immediate action, and the data team implements drastic restrictions overnight. Every query needs approval. Dashboards stop updating. Analysts can't do their jobs. Within weeks, exceptions become the rule, shadow systems emerge, and costs end up higher than before.
Successful programs start small. Pick one team or one use case. Implement basic cost visibility. Show value through optimization, not restriction. Then gradually expand. One logistics company started by optimizing just their inventory dashboards, saved $3,000 monthly, then used that success to build buy-in for broader governance.
Another failure pattern is governance without investment. You can't cut analytics costs 50% and expect the same insights. If you want efficiency, you need to invest in optimization—better data models, smarter aggregations, efficient infrastructure. Companies that successfully control costs typically spend several months optimizing before implementing restrictions.
The "tax collector" problem kills many programs. When the analytics team becomes the cost police, constantly blocking requests, they lose credibility as partners. Business users stop engaging, find workarounds, and governance becomes adversarial.
Position governance as enablement instead. "Here's how to get the insights you need more efficiently" works better than "You can't run that query." When you help teams optimize their workflows before implementing restrictions, they become allies rather than adversaries.
Technical governance without business context always fails too. Optimizing query performance doesn't help if you're running the wrong queries. A perfectly efficient dashboard that nobody uses still wastes money. The best governance programs include business stakeholders from the start, focusing on value, not just cost.
Modern architectures and the governance challenge
Cloud data platforms created governance challenges that traditional policies don't address. In the old world of on-premise databases, capacity was fixed. If you ran expensive queries, you slowed down everyone else—a natural feedback loop. Now, cloud platforms scale instantly. That poorly written query doesn't slow down others; it just costs more money.
Serverless architectures make things worse. They remove the friction of provisioning resources, which is great for agility but rough on cost control. An analyst can spin up massive compute power with a few clicks, run an experimental analysis, and forget to tear it down. By the time anyone notices, you've burned through thousands in idle resources.
Modern data stacks also fragment costs across multiple vendors. You're not just managing one database bill anymore. There's the data warehouse, the transformation tool, the orchestration platform, the visualization layer, the quality monitoring service. Each has its own billing model, usage patterns, and optimization levers. A query might look cheap in the warehouse but trigger expensive reprocessing in downstream tools.
The solution isn't going backward to monolithic systems. It's building governance that matches modern architectures. This means cross-platform cost aggregation that shows true end-to-end expenses, automated resource lifecycle management that cleans up idle resources, policy inheritance where governance rules flow through the entire pipeline, and cost attribution that follows data lineage rather than just direct usage.
Modern analytics service models need governance that reflects their distributed nature. The same query might be cheap in development but expensive in production. The same data might be free to store but costly to query. Governance policies must account for these nuances.
Making it stick: workflow integration
The best governance policies become invisible through workflow integration. Instead of separate cost reviews and approval processes, governance becomes part of how teams naturally work.
Integrate cost awareness into existing tools. Add cost estimates to pull request reviews for analytics code changes. Include efficiency metrics in sprint retrospectives. Make query optimization part of the definition review process for new metrics.
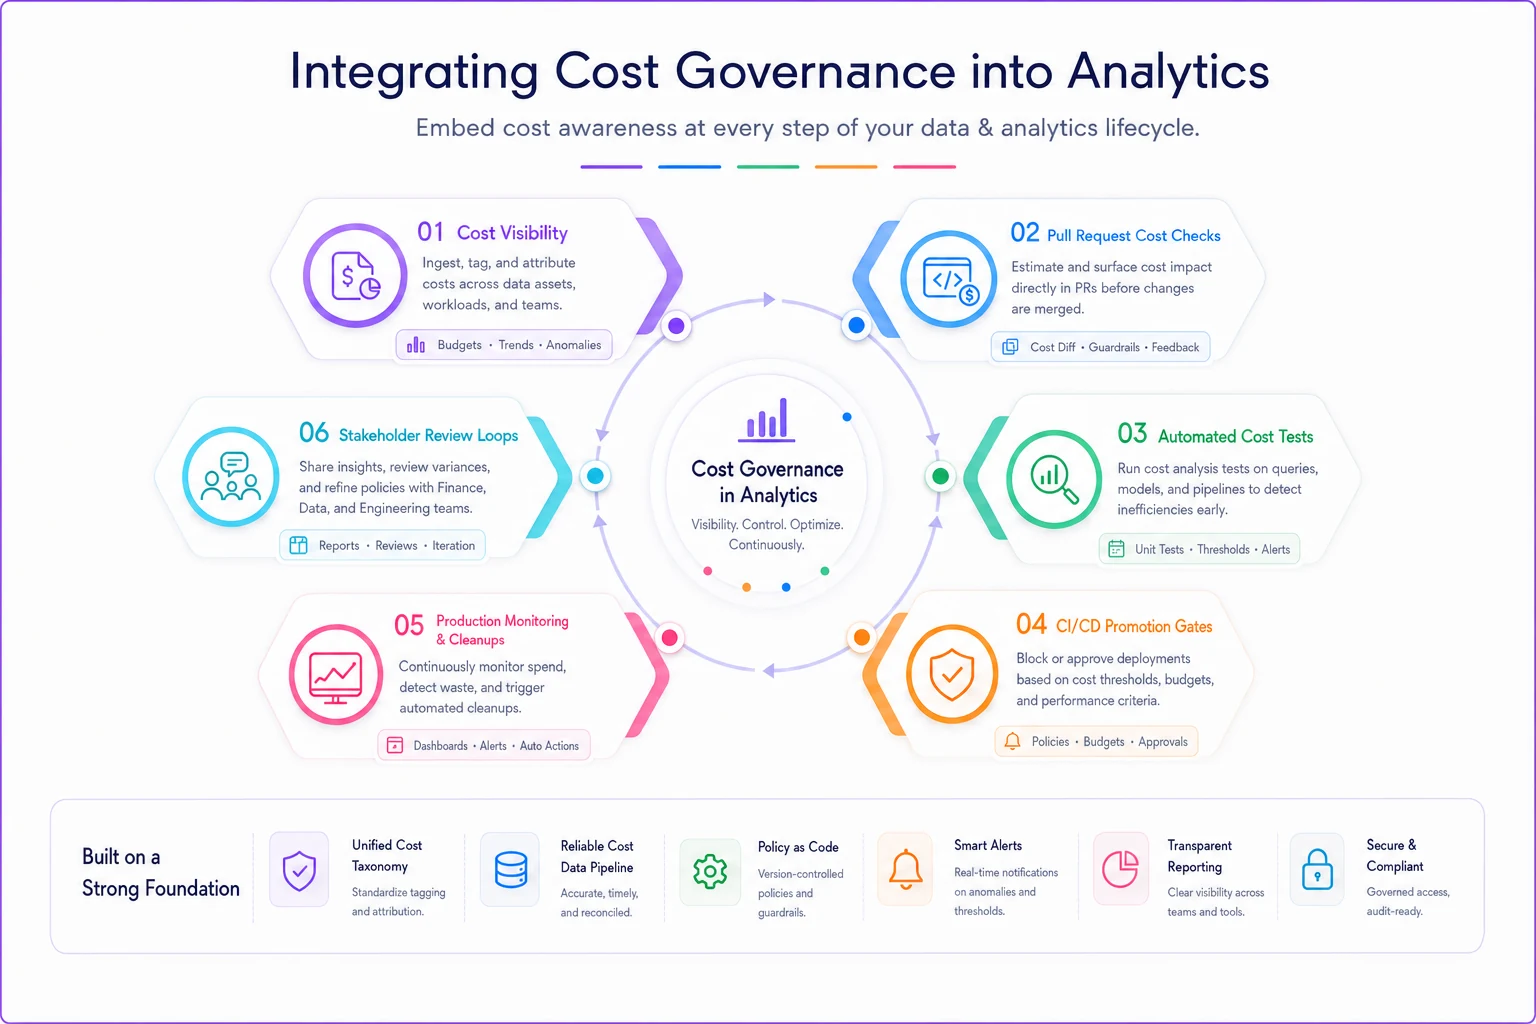
Here's a simple workflow for integrating governance into analytics pipelines.
Build governance into development workflows. Before promoting code to production, automatically run cost analysis. Flag expensive operations during code review. Require optimization for queries exceeding cost thresholds. This catches problems before they reach production, where fixes are more disruptive.
Connect governance to business planning. During quarterly planning, review analytics costs alongside project goals. When proposing new initiatives, include analytics cost estimates. Make efficiency improvements part of team objectives, not separate mandates from IT.
Automation reduces governance burden significantly. Instead of manually reviewing every dashboard, automated systems can identify optimization opportunities. Rather than approving every query, smart systems can route expensive operations appropriately. The less human intervention required, the more likely governance succeeds long-term.
Regular rituals reinforce good habits too. A monthly "optimization hour" where teams review and improve their most expensive queries. Quarterly cleanup where orphaned resources get identified and removed. Annual reviews where the entire analytics architecture gets evaluated for efficiency.
Measuring what matters
Most analytics governance programs track the wrong metrics. They focus on cost reduction percentages or query count limits. But these don't capture whether governance is actually working.
Better metrics focus on value and behavior change:
Cost per insight: Track the ratio of analytics costs to business decisions supported. A team spending $10,000 monthly to drive $1 million in optimization decisions is efficient. A team spending $5,000 to produce reports nobody reads isn't.
Query efficiency distribution: Look at the percentage of queries running efficiently, not just total cost. If 95% of queries are optimized but 5% consume half the budget, you have a different problem than if all queries are moderately inefficient.
Time to insight: Measure how quickly analysts can answer business questions. Good governance reduces waste without slowing down decision-making. If analysts need three days of approvals for simple analyses, governance has gone too far.
Adoption rate: Track how many teams actively participate in governance programs. High adoption means the program provides value. Low adoption suggests the policies don't match operational needs.
Shadow system growth: Monitor whether teams are building alternative analytics solutions. Growing shadow IT indicates governance is too restrictive. Consolidation suggests the program is working.
The most telling metric is often the simplest: are analytics costs growing slower than business value? A company doubling revenue while keeping analytics costs flat has effective governance. A company cutting analytics costs while insights decline has optimization theater.
Building your governance practice
Start with visibility, not restriction. For the first month, just track and report costs. Don't implement any limits or policies yet. Use this baseline to understand actual usage patterns and identify the biggest optimization opportunities.
Focus on the biggest wins first. Usually around 20% of queries drive 80% of costs. Find those expensive outliers and optimize them before implementing broad policies. Quick wins build credibility and fund future governance efforts.
Involve stakeholders early. Governance imposed by IT rarely sticks. When business users help design policies, they're more likely to follow them. Include analysts in optimization efforts so they learn efficient patterns rather than just following rules.
Document everything but keep it simple. Complex governance documents nobody reads don't help. Create one-page summaries for common scenarios. Build decision trees for edge cases. Make policy information accessible when users need it, not buried in wikis.
Plan for exceptions because they're inevitable. Some analyses genuinely require expensive processing. Some projects need real-time data. Build exception processes fast enough to be useful but structured enough to prevent abuse.
Review and revise regularly. Analytics needs change as businesses grow. What worked at $10 million revenue won't work at $100 million. Quarterly reviews keep governance aligned with business reality.
Most importantly, remember that analytics cost governance isn't about spending less—it's about spending smart. The goal isn't the cheapest possible analytics. It's the right analytics investment to drive business value, without waste, with clear accountability, and with room to grow.
The companies that get this right treat analytics like any other operational capability. They invest strategically, optimize continuously, and govern pragmatically. They don't let costs spiral out of control, but they also don't strangle innovation with excessive bureaucracy.
When analytics costs are predictable, when value is visible, and when teams naturally make efficient choices—that's successful governance. Everything else is just process theater that adds friction without improving outcomes.
Ready to elevate your business intelligence?
Join 2,500+ businesses leveraging Glasaly to drive smarter decisions, improve team alignment, and boost operational performance.