
Your conversion rate drops from 24% to 21% over twelve weeks. Not dramatic enough to trigger alerts. Not sudden enough to grab attention during Monday reviews. Just a quiet erosion that costs you $47,000 in lost revenue before anyone notices.
Metric drift detection isn't about catching massive failures. Those are easy. It's about recognizing the slow bleeds that compound into operational disasters while everyone's watching for dramatic spikes.
Why rolling windows miss gradual deterioration
Traditional monitoring compares yesterday to last week, last week to last month. Clean comparisons, terrible at catching drift.
A retail chain I worked with had their average order value declining by roughly $0.40 per week. Their week-over-week alerts never fired because each drop stayed within the 5% threshold. After sixteen weeks, they'd lost $6.40 per transaction—around $182,000 monthly—without a single alert.
The problem with standard monitoring approaches:
-
Fixed thresholds assume stable baselines
-
Period comparisons mask gradual changes
-
Averages hide distribution shifts
-
Single-metric views miss correlated degradation
Most businesses discover drift during quarterly reviews when someone finally asks why revenue is down 8% despite traffic being up 3%. By then, you're diagnosing history instead of preventing losses.
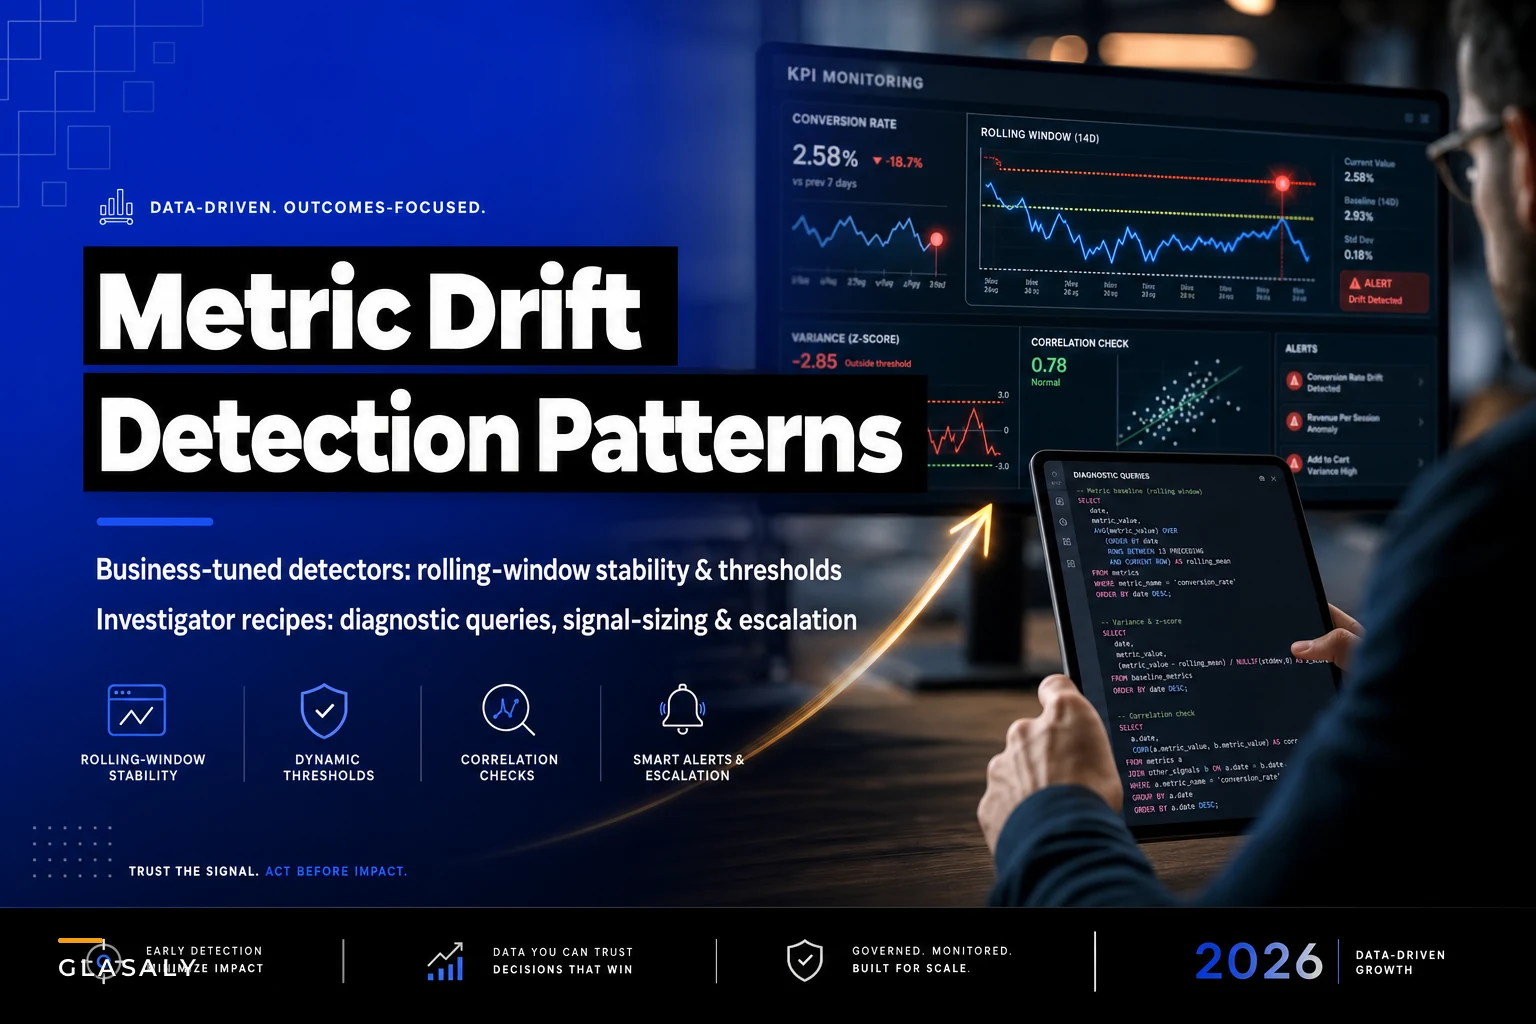
Pattern recognition: when stability metrics actually work
Stability checking requires different math than spike detection. You're not looking for outliers; you're measuring the rate of change in your baseline.
Stop missing critical business insights.
Glasaly helps you create, share, and track interactive dashboards effortlessly.
- Real-time data visualization
- Collaborative report sharing
- Customizable analytics widgets
No credit card required
A practical framework that catches drift before it compounds:
Rolling stability windows
``
Window 1: Days 1-30 baseline
Window 2: Days 8-37 (overlap + shift)
Window 3: Days 15-44 (overlap + shift)
``
Calculate the coefficient of variation for each window:
-
CV < 5%
Stable metric
-
CV 5-10%
Monitor closely
-
CV > 10%
Investigate drift
Business-tuned detection thresholds
Build thresholds from your metric's history:
| Metric Type | Natural Variance | Detection Threshold | Investigation Trigger |
|---|---|---|---|
| Revenue metrics | 3-7% daily | 2x variance | 3 consecutive breaches |
| Volume metrics | 10-15% daily | 1.5x variance | 5 consecutive breaches |
| Rate metrics | 5-8% daily | 2.5x variance | 4 consecutive breaches |
| Quality scores | 2-4% daily | 3x variance | 2 consecutive breaches |
An ecommerce platform discovered their cart abandonment rate climbing from 68% to 74% over two months. Daily variance looked normal, but the 30-day rolling average showed consistent upward drift starting six weeks before their payment processor changed their checkout flow.
Signal sizing: distinguishing real drift from noise
Not every metric movement indicates operational problems. Sometimes numbers drift because of seasonality, market changes, or random variation.
Effective signal sizing requires three components:
1. Baseline establishment
``
Weighted baseline =
  (Last 7 days × 0.4) +
  (Days 8-30 × 0.3) +
  (Days 31-90 × 0.2) +
  (Same period last year × 0.1)
``
2. Variance bands
-
Inner band
1 standard deviation (68% of values)
-
Monitoring band
2 standard deviations (95% of values)
-
Alert band
2.5+ standard deviations (99% of values)
Track how many consecutive periods fall outside each band. Three periods outside the inner band often predicts drift before it becomes critical.
3. Correlation checking
-
Conversion rate + average order value
-
Support tickets + customer satisfaction
-
Page load time + bounce rate
-
Inventory turnover + gross margin
When multiple correlated metrics drift together, you've found real signal. When a single metric drifts alone, investigate data quality first.
The investigator's checklist for metric erosion
When drift detection triggers, most teams waste hours checking everything. A prioritized investigation sequence typically finds root causes within 30 minutes:
Phase 1: Data integrity (5 minutes)
``sql
-- Check for missing data
SELECT DATE(createdat) as day,
COUNT() as records
FROM transactions
WHERE createdat >= CURRENTDATE - INTERVAL '30 days'
GROUP BY 1
ORDER BY 1;
-- Verify collection completeness
SELECT sourcesystem,
COUNT() as events,
COUNT(DISTINCT userid) as uniqueusers
FROM events
WHERE date >= CURRENT_DATE - 7
GROUP BY 1;
``
Start with data integrity checks—many drifts are instrumentation or collection issues that look like real problems.
Phase 2: Segment decomposition (10 minutes)
``sql
-- Identify which segments drive the drift
WITH segmenttrends AS (
SELECT customersegment,
DATETRUNC('week', orderdate) as week,
AVG(ordervalue) as avgvalue,
COUNT(*) as orders
FROM orders
WHERE orderdate >= CURRENTDATE - INTERVAL '60 days'
GROUP BY 1,2
)
SELECT customersegment,
week,
avgvalue,
avgvalue - LAG(avgvalue) OVER (PARTITION BY customersegment ORDER BY week) as weekchange
FROM segmenttrends
ORDER BY customersegment, week;
``
Phase 3: External factor correlation (10 minutes)
Check for changes that coincide with drift onset:
-
Marketing campaign changes
-
Pricing adjustments
-
Competitor actions
-
Technical deployments
-
Process modifications
Map these against your drift timeline. A dental practice network found their appointment completion rate dropping 3% monthly after switching scheduling software—but the drift started two weeks before the switch, when staff began dual-entering appointments in preparation.
Phase 4: Distribution analysis (5 minutes)
Averages hide distribution changes. Check if drift comes from:
-
Outlier changes (top/bottom 10% behaving differently)
-
Median shifts (broad behavioral change)
-
Variance increases (growing inconsistency)
``sql
-- Distribution comparison
SELECT
CASE
WHEN orderdate >= CURRENTDATE - 7 THEN 'currentweek'
WHEN orderdate >= CURRENTDATE - 35 THEN 'pastmonth'
ELSE 'historical'
END as period,
PERCENTILECONT(0.25) WITHIN GROUP (ORDER BY metricvalue) as p25,
PERCENTILECONT(0.50) WITHIN GROUP (ORDER BY metricvalue) as median,
PERCENTILECONT(0.75) WITHIN GROUP (ORDER BY metricvalue) as p75,
PERCENTILECONT(0.95) WITHIN GROUP (ORDER BY metricvalue) as p95
FROM metricdata
WHERE orderdate >= CURRENT_DATE - 90
GROUP BY 1;
``
This phase often reveals the most insight. A manufacturing company's quality scores showed stable averages but increasing variance—product defects weren't getting worse on average, but consistency was degrading. The issue traced to machine calibration drift affecting random batches.
Alert sizing: avoiding fatigue while catching problems
The worst drift detection system triggers fifty alerts daily. The second worst triggers zero alerts while metrics deteriorate.
Proper alert sizing balances sensitivity with actionability:
Severity tiers
Tier 1: Monitor silently
-
Drift detected but within acceptable business variance
-
Log for pattern analysis
-
No immediate action required
Tier 2: Team notification
-
Drift exceeding normal bounds for 3+ periods
-
Notify relevant team via dashboard/Slack
-
Investigation within 24 hours
Tier 3: Immediate escalation
-
Critical metric drift affecting revenue/customers
-
Multiple correlated metrics drifting together
-
Page responsible party immediately
Alert frequency governance
Never alert on the same drift pattern more than once per day. Track:
-
Initial detection timestamp
-
Notification history
-
Investigation status
-
Resolution actions
A logistics company reduced daily alerts from 47 to 6 by implementing progressive thresholds: first breach logs internally, second breach notifies team lead, third breach escalates to operations manager. False positives dropped 85% while catching the same number of real issues.
Building automated drift detection without the complexity
Most drift detection fails because teams try building sophisticated statistical models instead of practical monitoring systems.
Start with these three components:
-
Simple rolling calculations - 7-day, 30-day, and 90-day rolling averages - Period-over-period change rates - Coefficient of variation tracking
-
Business context rules - Expected seasonality patterns - Acceptable variance ranges - Correlation expectations
-
Clear response protocols - Who investigates which metrics - Standard investigation queries - Escalation criteria
Modern operational platforms can automate this entire detection workflow. Instead of manually calculating rolling windows and variance bands, AI-powered operational software continuously monitors your metrics for drift patterns. These systems learn your business's natural rhythms, automatically adjusting thresholds based on historical patterns and seasonal variations.
The real value comes from connecting drift detection to investigation workflows. When the system identifies concerning trends, it can automatically run diagnostic queries, check correlated metrics, and compile investigation reports—turning what typically takes hours of analysis into minutes of review.
Here's a simple diagram of how automation ties data collection, detection, and investigation together.
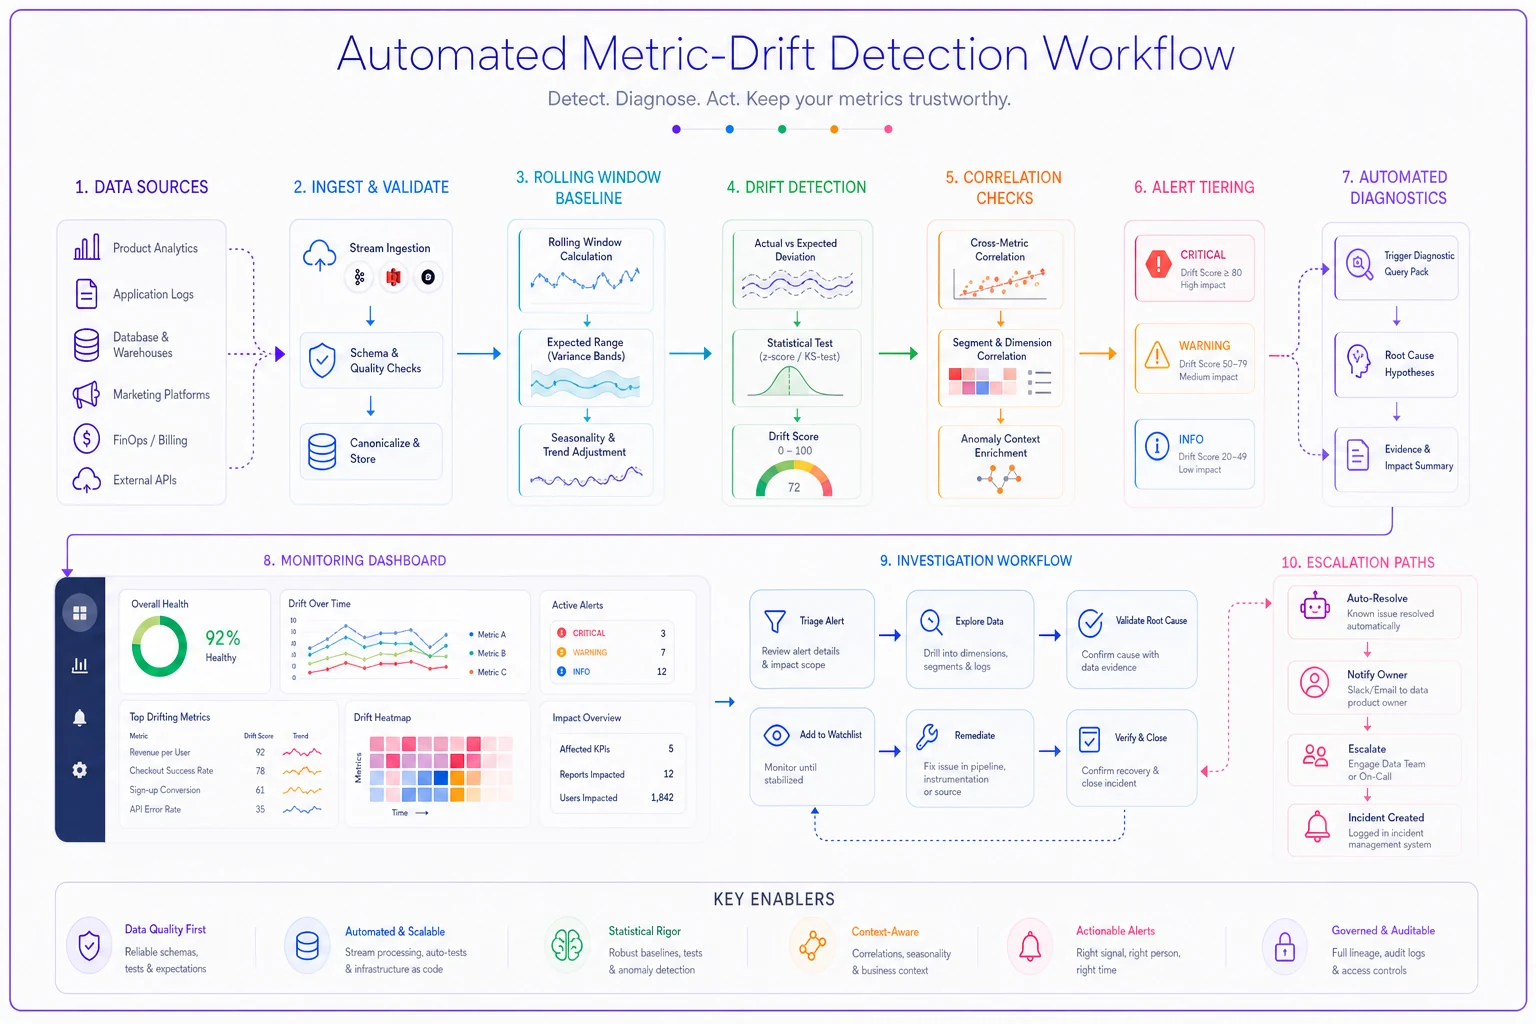
For businesses managing dozens or hundreds of KPIs, this automation prevents the small erosions that compound into major problems. Your governance framework defines which metrics matter; drift detection ensures they stay healthy.
Investigation recipes for common drift patterns
Revenue per customer declining
Check sequence:
-
Order frequency changes
-
Average order value shifts
-
Customer segment mix evolution
-
Discount/promotion usage increases
-
Product mix changes
``sql
WITH customermetrics AS (
SELECT customerid,
DATETRUNC('month', orderdate) as month,
COUNT(*) as orders,
AVG(ordertotal) as avgorder,
SUM(discountamount) as totaldiscounts
FROM orders
WHERE orderdate >= CURRENTDATE - INTERVAL '6 months'
GROUP BY 1,2
)
SELECT month,
AVG(orders) as avgorderfrequency,
AVG(avgorder) as avgordervalue,
AVG(totaldiscounts) as avgdiscountusage,
COUNT(DISTINCT customerid) as activecustomers
FROM customer_metrics
GROUP BY 1
ORDER BY 1;
``
Conversion rate erosion
Check sequence:
-
Traffic quality changes
-
Page performance degradation
-
Checkout/form completion rates
-
Device/browser distribution shifts
-
Competition or market changes
Support ticket increases
Check sequence:
-
Product/feature specific patterns
-
Customer segment concentration
-
Issue category distribution
-
First response time correlation
-
Recent changes or deployments
For each pattern, document what you find. These investigations become templates for future drift events, building institutional knowledge about which patterns indicate real problems versus normal variation.
Preventing drift through operational discipline
The best metric drift detection finds nothing because your operations prevent drift from starting.
Key preventive measures:
Regular metric audits Review metric definitions quarterly. Ensure calculations remain relevant and data sources stay reliable. Small definitional drift often causes apparent performance drift.
Change documentation Log every operational change that might affect metrics: pricing updates, process modifications, tool switches, team changes. When drift appears, this changelog immediately narrows investigation scope.
Baseline refreshing Update your "normal" ranges quarterly. Businesses evolve, and yesterday's normal becomes today's problem. A subscription service discovered their "normal" churn rate had crept from 5% to 8% over two years—their drift detection never fired because baselines never updated.
Proactive correlation monitoring Don't wait for drift to check metric relationships. Regular correlation analysis reveals when relationships change before individual metrics drift significantly.
Making drift detection stick
Metric drift detection only works when it becomes part of operational rhythm, not another dashboard nobody checks.
Successful implementations share three characteristics:
They start small—monitoring 5-10 critical metrics rather than everything. They integrate with existing workflows rather than creating new processes. They focus on investigation and resolution, not just detection.
A home services company started by monitoring just three metrics: booking rate, average ticket value, and customer callback rate. Their simple spreadsheet-based system caught a gradual decline in booking rates traced to their online scheduling system timing out for mobile users. The fix recovered roughly $35,000 in monthly bookings.
You don't need sophisticated algorithms to catch metric drift. You need consistent monitoring, clear investigation protocols, and the discipline to investigate small changes before they become big problems.
Connected operational platforms handle this automatically, continuously watching for drift patterns while your team focuses on running the business. But even manual monitoring beats discovering problems at quarter-end when the damage is already done.
The patterns and recipes in this guide come from watching hundreds of businesses miss gradual degradation until it became crisis. Your investigation playbook determines how quickly you resolve issues once found. Drift detection ensures you find them while they're still small enough to fix easily.
Start with one critical metric. Set up rolling-window monitoring. Document what normal looks like. Then watch for the quiet erosions that compound into tomorrow's emergencies. Because in operations, the most expensive problems are the ones that sneak up on you one percentage point at a time.
Ready to elevate your business intelligence?
Join 2,500+ businesses leveraging Glasaly to drive smarter decisions, improve team alignment, and boost operational performance.