



The worst part about cross-region KPI drift is that nobody notices until a number gets questioned in a room full of executives. The EMEA lead says revenue was €2.1M. Finance says €2.06M. Someone from the US team pulls up the dashboard and sees $2.24M, which doesn't match either. All three are "right." They just applied different conversion rates, different cutoffs, and different definitions of what "last month" means.
This isn't a rounding problem. It's a canonicalization problem — the absence of a single, agreed-upon way to transform raw regional numbers into one comparable baseline. And the longer it goes unfixed, the more your quarterly reviews turn into reconciliation arguments instead of actual decisions.
What follows is a tight, usable set of rules for the three things that actually cause the drift: currency conversion, timezone windowing, and reconciliation. Plus the mapping sheets and scripts that make them hold up over time.
Where the drift actually comes from
Before getting into the rules, it helps to be precise about the mechanics. Cross-region KPI drift almost always traces back to one of four sources:
-
Different FX rates applied at different times. One team uses the daily close rate, another uses a monthly average, a third uses whatever the ERP had cached.
-
Different period boundaries. "October" in Sydney starts almost a full day before "October" in San Francisco. If you sum transactions by local timestamp and then roll them up, your month edges don't line up.
-
Different filters baked into the source extract. The APAC extract quietly excludes internal test accounts; the EU extract doesn't.
-
Different grain of rounding. Converting line items vs. converting the summed total produces different answers once you're dealing with thousands of rows.
The frustrating thing is each regional team is internally consistent. The problem is between regions. Nobody owns the seam. So the first rule of a working global measurement playbook is that canonicalization logic lives in one place, applied once, and never gets re-implemented per region.
Rule set 1: Currency conversion templates
Currency is the loudest source of disputes because it's the easiest to argue about. The fix isn't picking the "correct" rate — there isn't one. The fix is committing to a named conversion method per metric and documenting it so nobody has to guess.
Stop missing critical business insights.
Glasaly helps you create, share, and track interactive dashboards effortlessly.
- Real-time data visualization
- Collaborative report sharing
- Customizable analytics widgets
No credit card required
| Metric type | Conversion method | Rate source | Rate timing |
|---|---|---|---|
| Recognized revenue | Monthly average rate | Treasury-approved feed | Average over the reporting month |
| Daily bookings / pipeline | Daily close rate | Same feed | Rate as of transaction date |
| Balance-sheet style snapshots | Spot rate | Same feed | Rate on the snapshot date |
| Board-level trended KPIs | Fixed budget rate | Finance budget | Locked for the fiscal year |
The non-obvious insight here: mixing methods inside one chart is where credibility dies. If your YoY revenue trend uses the current month's live rate for this year but an average for last year, you've baked FX movement into what looks like a business trend. Pick one method per metric and freeze it for the whole series.
A few concrete rules that save you later:
-
Convert at the lowest grain, then aggregate. Convert each transaction (or each daily total), then sum. Don't sum local amounts and convert once — you'll lose the rate variation that actually happened.
-
Store the raw local amount, the rate used, and the converted amount as three separate columns. When someone disputes a number, you can show your work in ten seconds instead of re-deriving it.
-
Pin the rate source to a version. "ECB reference rate, published 16:00 CET" is auditable. "The rate we grabbed" is not.
-
Handle the fiscal budget rate separately. Board trends often use a locked rate so business performance isn't masked by currency swings. That's a legitimate second view — just label it clearly so it never gets compared against spot-rate numbers.
Store the raw local amount, the rate used, and the converted amount as three separate columns.
A sample mapping row for a conversion template looks like this:
``
metricid: revenuerecognized
sourcecurrency: EUR
targetcurrency: USD
conversionmethod: monthlyavg
ratefeed: treasury.fx.v3
rateperiod: 2024-10
ratevalue: 1.0847
rounding: 2dpafter_sum
``
Once that row exists, every region fills in the same fields. The template is the agreement.
Rule set 2: Timezone and windowing rules
This is the quieter killer. Currency disputes get caught because the gap is visible. Timezone drift hides because the numbers are "close enough" until a close-of-month comparison or a daily cohort suddenly looks off by a chunk.
-
UTC everywhere. Every timestamp normalized to UTC, periods cut on UTC boundaries. Cleanest for engineering, slightly unintuitive for regional teams ("our Monday starts Sunday afternoon").
-
A single anchor timezone (often HQ or finance's timezone). Everyone's "October" means October in that one zone.
-
Local period boundaries with explicit reconciliation. Each region closes on its own local midnight, and you accept that the global roll-up has fuzzy edges you explicitly document.
Most teams that do this well pick UTC for storage and a single anchor timezone for reporting windows. Store in UTC, apply the anchor only at the final windowing step.
A simple visualization of the windowing workflow can help align engineers and finance before implementation.
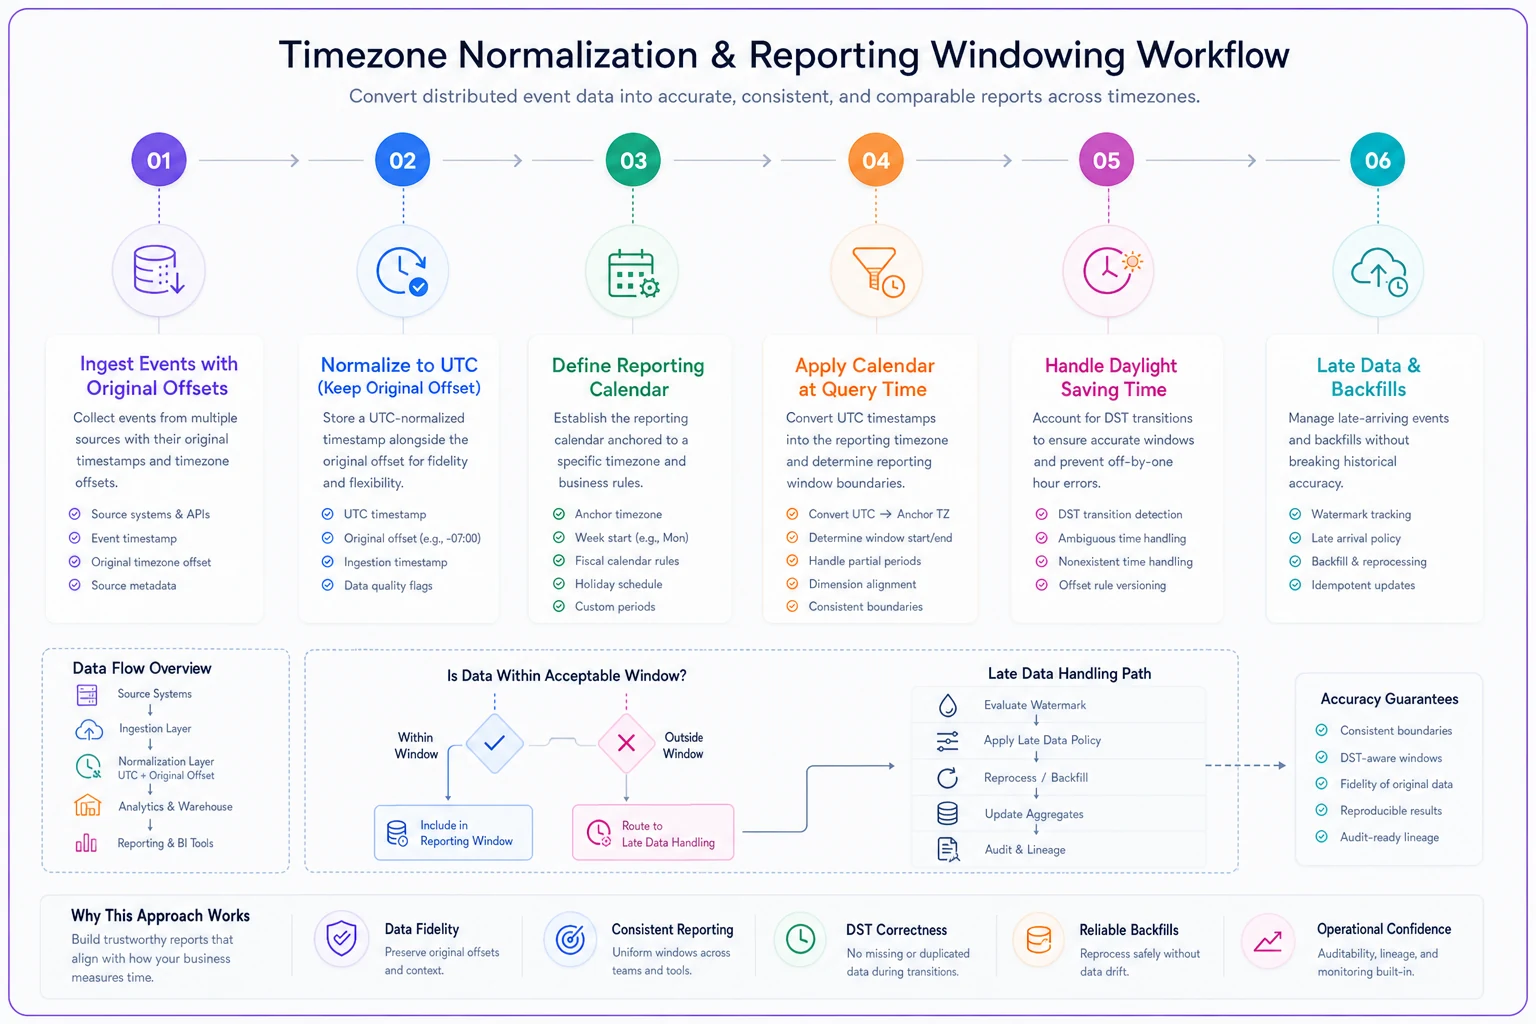
The mistake that creates the most pain: cutting the period on local timestamps and then rolling regions together. You get double-counted or missing hours at the seams, and daily KPIs wobble by a few percent in a way that looks like real movement.
A workable windowing rule, written out:
-
Ingest every event with its original timezone offset preserved.
-
Normalize to UTC on landing — never overwrite the original offset, add a UTC column alongside it.
-
Define the reporting calendar once (e.g., "fiscal periods close at 00
00 America/New_York").
-
Apply that calendar at query time, converting the UTC column to the anchor zone for the boundary comparison only.
-
Document daylight-saving handling explicitly, because the one night a year the clock shifts is the one night your daily totals will look broken.
The pattern worth internalizing: separate when something happened from which period it counts in. Those are two different questions, and treating them as one is how windowing drift sneaks in. This connects directly to how you handle events that arrive after the fact — if your late data strategy is shaky, your windows will drift even with perfect timezone logic. The mechanics of managing late-arriving data and backfills with watermarking and acceptance windows pair directly with these windowing rules; they're two halves of the same boundary problem.
Rule set 3: Reconciliation checks that catch drift early
Conversion and windowing rules prevent drift. Reconciliation checks prove they're working — and catch the day someone quietly changes an extract.
The goal is a small set of automated checks that run every time the global KPIs refresh, comparing the canonical roll-up back against the sum of regional sources. Not a giant test suite. A handful of checks that would actually fire if something broke.
Here's a reconciliation check you can lift and adapt:
``sql
-- Regional sum vs canonical roll-up, revenue
WITH regional AS (
SELECT region,
SUM(amountconverted) AS regiontotal
FROM factrevenuecanonical
WHERE periodid = :period
GROUP BY region
),
canonical AS (
SELECT SUM(amountconverted) AS globaltotal
FROM factrevenuecanonical
WHERE periodid = :period
)
SELECT c.globaltotal,
SUM(r.regiontotal) AS summedregions,
c.globaltotal - SUM(r.regiontotal) AS drift
FROM canonical c
CROSS JOIN regional r
GROUP BY c.globaltotal
HAVING ABS(c.globaltotal - SUM(r.regiontotal)) > 1.00;
``
If that query returns a row, your global total and your regional totals disagree by more than a dollar, and someone needs to look before the dashboard refreshes.
A second check worth running catches the sneakier failure — rates drifting out of band:
``sql
-- Flag conversion rows using an unexpected rate
SELECT metricid, sourcecurrency, ratevalue, rateperiod
FROM conversionlog
WHERE rateperiod = :period
AND ABS(ratevalue - expectedrate) / expected_rate > 0.02;
``
Anything more than 2% off the expected feed value gets flagged. That single check catches cached rates, manual overrides, and the classic "someone hardcoded last quarter's rate" problem.
The checks worth running on every refresh:
-
Row-count parity does the canonical table have the same count as the sum of regional extracts (after documented filters)?
-
Currency reconciliation regional converted totals sum to the global total within a dollar.
-
Rate-band check every applied rate is within tolerance of the approved feed.
-
Window-edge check no transactions landing in two periods or in zero periods.
-
Filter parity the same exclusion rules (test accounts, refunds, internal orders) applied across all regions.
The insight most teams miss: reconciliation isn't a one-time validation, it's a standing alarm. The rules don't break on day one when everyone's paying attention. They break three months later when a source system changes and nobody connected it to the KPI. Checks that run on every refresh are what turn drift from a quarterly surprise into a same-day ticket.
Sample mapping sheet that preserves baselines
The mapping sheet is the artifact that keeps everyone honest. It's boring, which is exactly why it works. One row per metric-per-region, every transformation documented.
| Column | Example | Purpose |
|---|---|---|
| metric_id | revenue_recognized | Canonical name, no regional variants |
| region | EMEA | Source region |
| source_currency | EUR | Pre-conversion currency |
| conversion_method | monthly_avg | Must match the conversion template |
| rate_feed | treasury.fx.v3 | Versioned source |
| source_timezone | Europe/Berlin | Original event zone |
| reporting_anchor | America/New_York | Window boundary zone |
| exclusion_rules | testaccts, internalorders | Filters applied |
| baseline_value | 2,060,114 | The agreed starting number |
| owner | emea-finance | Who answers questions |
That baseline_value column is doing more work than it looks like. It's the frozen reference everyone agreed on at the start of the period. If a later refresh moves away from it, the reconciliation check fires and you have a documented number to diff against. Without a committed baseline, there's nothing to drift from — every value is just the current value, and arguments become unwinnable.
Keeping these mapping sheets consistent across dozens of metrics is really a metric-definition discipline problem. If your broader metric catalog is sprawling and undefined, regional mapping sheets won't save you. The foundations in stopping metric sprawl with a governance framework and enforceable taxonomy are what make these sheets enforceable instead of aspirational.
A real scenario
A mid-sized SaaS company selling across the US, UK, and Australia ran monthly revenue reviews that regularly stalled on "whose number is right." Three teams, three spreadsheets, three FX approaches. The reported global revenue swung by roughly 3–4% depending on whose version was on screen — which on a roughly $24M annual run rate meant six figures of phantom variance showing up in trend lines.
The fix wasn't a new tool or a re-platform. They did three things:
-
Standardized on monthly-average conversion for recognized revenue, pinned to the treasury feed, converted at transaction grain.
-
Moved all event storage to UTC and set a single fiscal anchor (New York) for period boundaries.
-
Added the five reconciliation checks above to run on every refresh.
Within two cycles, the global number stopped moving between meetings. The reconciliation checks caught two real issues in the first month — a cached rate in the UK extract and a test-account filter missing from the AU source — both of which would have quietly skewed the quarter. The monthly review went from arguing about the number to actually discussing what it meant.
Nothing about that was glamorous. The mapping sheet, the rate-band check, the UTC storage rule. But that's the point: cross-region KPI drift is fixed with boring consistency, not clever math.
When this level of rigor is worth it — and when it isn't
Do this if you report consolidated KPIs across two or more currencies or timezones, your numbers get questioned in decision-making rooms, or finance and ops regularly disagree on "the same" metric. The reconciliation overhead pays for itself the first time it catches a bad rate before it hits a board deck.
You probably don't need the full apparatus if you operate in a single currency and a single timezone, or your cross-region reporting is directional-only and nobody's making real decisions on the exact figure. Building committed baselines and rate-band checks for a metric nobody acts on is just ceremony.
Who should not do this halfway: teams that implement conversion templates but skip reconciliation. Conversion rules without checks give you a false sense of correctness — you've documented the intent but never verified reality matches it. That's arguably worse than no rules at all, because people trust the number more.
Making it stick
The rules above are cheap to write and hard to maintain, and that's the real challenge. Canonicalization logic rots the moment a source system changes, a new region launches, or someone adds a currency. The teams that keep baselines stable treat the mapping sheet as a living contract with named owners, run reconciliation on every refresh rather than every quarter, and refuse to let any region re-implement conversion logic locally.
A working global measurement playbook isn't a document you write once. It's the conversion template, the windowing rule, the reconciliation check, and the mapping sheet — all applied in one place, owned by someone, and verified every time the numbers move. Get those four things locked and the quarterly "whose number is right" argument just quietly stops happening.
Get those four things locked and the quarterly "whose number is right" argument just quietly stops happening.
Ready to elevate your business intelligence?
Join 2,500+ businesses leveraging Glasaly to drive smarter decisions, improve team alignment, and boost operational performance.