



There's a specific failure mode that shows up months after an A/B test wraps: a metric invented for one experiment quietly becomes a permanent KPI on an executive dashboard. Nobody decided to promote it. It just... stayed. And now finance is forecasting off a number calculated with test-specific assumptions that stopped being true weeks ago.
This is the part of experiment metrics alignment nobody writes runbooks for. Everyone documents how to design the experiment and read the result. Almost nobody documents the handoff—the moment a scrappy experiment metric gets adopted into the canonical set of numbers the business actually runs on. That gap is where bad KPIs are born.
This post is only about that handoff. Not experiment design, not statistical significance, not sample sizing. Just the promotion step: how to verify an experiment metric is safe to become a production KPI, and how to catch the ones that aren't.
The specific way this goes wrong
Let me be precise about the failure, because "bad metrics" is too vague to actually fix.
An experiment metric almost always ships with hidden context baked in. During a checkout test, an analyst defines qualified_conversion as "user reached the confirmation page AND cart value > $20 AND not flagged as internal traffic." Perfect for the experiment. The definition lives in a notebook or a one-off dbt model tagged with the experiment name.
The test wins. Somebody screenshots the lift. A director asks, "can we track qualified conversion going forward?" An engineer wires up a dashboard tile pointing at a slightly different query, because the original experiment model got deprecated. The new version drops the cart value > $20 filter because nobody remembered it was there.
Now you have two things called "qualified conversion" producing different numbers, and the production one silently over-counts by maybe 15–20%. The experiment result and the ongoing KPI no longer describe the same thing. Six weeks later someone reruns the analysis and can't reproduce the original win.
That's the whole disaster in miniature. It's not a stats problem. It's a lineage and definition-transfer problem, and it happens at the promotion boundary.
Why experiment metrics are uniquely dangerous to promote
Production KPIs and experiment metrics are built for opposite purposes, and people forget that when they try to promote one into the other.
Stop missing critical business insights.
Glasaly helps you create, share, and track interactive dashboards effortlessly.
- Real-time data visualization
- Collaborative report sharing
- Customizable analytics widgets
No credit card required
| Property | Experiment metric | Production KPI |
|---|---|---|
| Lifespan | Days to weeks | Indefinite |
| Assumptions | Frozen at test start | Must survive schema/behavior changes |
| Audience | One analyst, one PM | Finance, execs, downstream teams |
| Filters | Aggressive, test-specific | General, stable |
| Failure tolerance | High (it's exploratory) | Low (people make decisions on it) |
| Backfill behavior | Rarely matters | Critical—history must stay consistent |
The trap is that experiment metrics look production-ready. They have a name, a number, a chart. But they're calibrated to a snapshot in time. The not flagged as internal traffic filter assumed a specific internal-IP list. The event mapping assumed the old checkout funnel. None of that is written down anywhere a downstream consumer would see it.
What tends to happen across analytics teams is that the metric "just needs to be promoted" is usually the one carrying the most undocumented assumptions—precisely because it was built fast, for one question.
Canonical event mapping comes first
Before you verify anything, you have to agree on what events the metric is actually counting. Teams skip this because it feels like busywork. It isn't.
Experiment metrics frequently reference raw event names directly—btncheckoutclickv2, purchasecompletedweb. Production KPIs should reference canonical events, not raw ones. That distinction matters because raw event names churn constantly. A mobile rewrite renames purchasecompletedweb to orderconfirmed, and your promoted KPI flatlines to zero without throwing an error.
-
List every raw event the experiment metric touches.
-
Map each to a canonical, versioned event definition—the thing that survives platform changes.
-
Note any event with no canonical equivalent. These are your highest-risk dependencies.
-
Flag any filter logic embedded in event selection, like device, region, or traffic-source filters.
-
Decide whether each embedded filter belongs in the canonical KPI or was purely experimental.
That last step is where most bad promotions get caught. A good chunk of the "hidden assumption" problems trace back to a filter that made sense for the test and quietly distorts the production number.
Keep a central, versioned event registry so mappings are easy to verify.
If your organization already maintains an enforceable metric taxonomy, this step is much lighter—you're just mapping the experiment into an existing vocabulary. If you don't have that foundation yet, our writeup on stopping metric sprawl with a governance framework and enforceable metric taxonomy covers how to build the canonical layer this whole process depends on.
The guardrails that actually catch bad promotions
Guardrails here aren't statistical significance thresholds. They're operational constraints that stop a fragile metric from becoming load-bearing.
A promotion guardrail is a check the metric must pass before it earns a spot on a production dashboard. The useful ones are boring:
-
Volume floor. If the metric relies on a segment with fewer than a few thousand events a day, it'll be too noisy as a daily KPI. Fine for an experiment, dangerous as a trend line execs stare at.
-
Filter transparency. Every filter in the definition must be explicitly listed and justified. "We filter internal traffic" is fine. An unexplained
WHERE region != 'XX'is a blocker. -
Reproducibility window. Can you recompute last month's value today and get the same number? If backfills or late data shift it by more than a percent or two, it's not stable enough.
-
Ownership. No promotion without a named owner. Orphaned metrics rot.
-
Naming collision check. Does a metric with this name already exist somewhere? If yes, you reconcile before promoting, not after.
The volume floor guardrail gets ignored the most and causes the most pain. A team promoted a "power user activation rate" from an experiment where the treatment cohort was healthy-sized. As a company-wide KPI it was computed on a much smaller natural population, and it swung 8–12 points week to week. Leadership spent three planning cycles reacting to noise before anyone realized the denominator was too small to trust.
Verification tests: prove the two numbers match
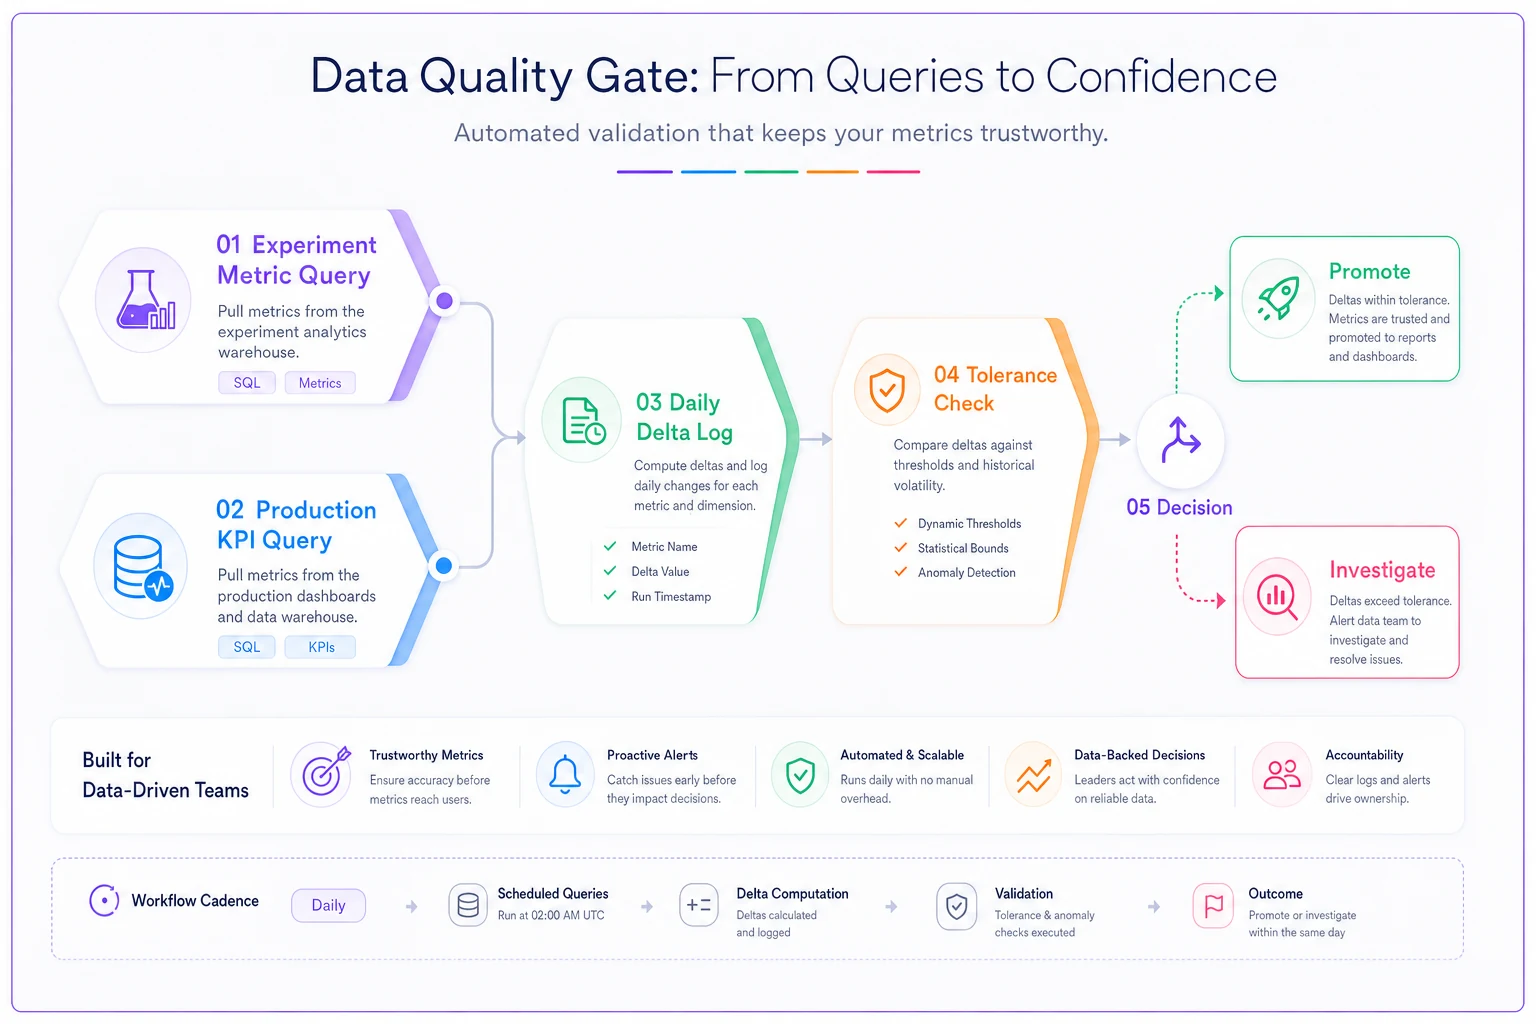
Before you retire the experiment metric and switch to the production version, run them in parallel and prove they agree. Not roughly. Within a tight tolerance you define up front.
[Experiment metric query] ──┐ ├──► [Daily delta log] ──► [Tolerance check] ──► Promote or Investigate [Production KPI query] ──┘
Keep the original experiment query running alongside the new production definition for a defined overlap period—a couple of weeks is usually enough. Each day, compute both, diff them, and log the delta. If the delta stays inside tolerance (say, under 1%), the promotion is verified. If it drifts, you investigate before anyone downstream sees the production number.
This parallel run is the single highest-value practice in the whole playbook, and almost nobody does it because it feels redundant. It isn't. It's the only thing that catches a dropped filter, a changed event name, or a timezone mismatch between the notebook and the warehouse.
Workflow visualized:
A few verification checks worth automating:
-
Row-count parity between experiment source and production source on the same date range.
-
Aggregate parity—the final metric value, obviously, but also intermediate sums.
-
Distribution check—not just the total, but whether the shape across segments matches. Totals can agree while segments quietly compensate for each other.
-
Edge-date behavior—first and last day of the window, where partial data and timezone bugs love to hide.
The distribution check catches something the total never will. Two metrics can sum to the same number while one over-counts mobile and under-counts desktop by offsetting amounts. If you promote based on the total alone, you ship a metric that's wrong for every segment but right in aggregate—which is arguably worse than being obviously wrong.
Lineage checks before you flip the switch
Once the numbers verify, you check where the metric comes from and where it's about to go. Promotion without lineage is how a single upstream table change silently breaks a board-level KPI.
-
What tables and models feed this metric, and who owns each one?
-
Are any of those sources themselves experiment-scoped or temporary?
-
What's the freshness SLA on each upstream source? A KPI can't be fresher than its slowest dependency.
-
If an upstream source changes schema, does this metric fail loudly or silently?
-
Who downstream will consume this once it's promoted—and do they know it's coming?
That fourth point is the one that bites. Experiment models are often built on temporary staging tables or notebook-scoped extracts that get cleaned up. Promote a KPI on top of one of those, and it works fine until someone's monthly cleanup job deletes the source. The dashboard doesn't error—it just shows the last cached value or a flat line, and nobody notices for weeks.
Before promoting, trace every dependency back to a permanent, owned source. If any link in the chain is temporary, experiment-scoped, or unowned, that link has to be rebuilt on stable ground first. The promoted KPI inherits the reliability of its weakest dependency.
A real scenario
A mid-sized subscription e-commerce team—around 40 people, a two-person analytics function—ran a pricing experiment and defined a metric called "trial-to-paid velocity": days from signup to first payment, filtered to trials that started after the new pricing page shipped.
The experiment showed a solid improvement, and leadership wanted it as a standing KPI. The analytics team promoted it the fast way: pointed a dashboard at a rebuilt query, no parallel run.
The rebuilt version dropped the "trials started after the pricing change" filter. So the production KPI blended old-pricing and new-pricing trials, and the headline velocity number looked roughly 20% worse than the experiment had shown. Leadership thought the win had evaporated. The team spent close to three weeks re-investigating a result that was never actually wrong—the promoted metric was just measuring a different population.
After that, they adopted a two-week parallel-run rule for any experiment metric headed to production. On the next promotion, the parallel run flagged a 6% daily delta within the first two days, traced to a timezone mismatch between the notebook (UTC) and the warehouse view (local). They fixed it before anyone downstream ever saw the number. The promotion that used to spark firefights became a routine checklist item—which is exactly what you want a KPI promotion to be.
When to promote, and when to absolutely not
Not every good experiment metric should become a KPI. Some are genuinely one-time-use.
Promotion makes sense when:
-
The metric answers a recurring question, not a one-time one.
-
Its definition is stable and doesn't depend on the experiment's specific setup.
-
It has a healthy, sustainable volume outside the test cohort.
-
There's an owner willing to maintain it.
Promotion is a bad idea when:
-
The metric only makes sense relative to a treatment/control split that won't exist going forward.
-
Its value depends on filters that were meaningful only during the test window.
-
The underlying population is too small to produce a stable daily or weekly trend.
-
No one will own it after the analyst who built it moves on.
Who should not do this at all: teams without a canonical event layer or a metric owner model. If you can't answer "what is the canonical definition of this event" and "who owns this number," you're not ready to promote experiment metrics—you'll just manufacture sprawl faster. Fix the foundation first.
The promotion checklist
Run through this before any experiment metric earns production status:
-
Every raw event mapped to a canonical, versioned definition
-
All embedded filters listed and each one justified or removed
-
Volume floor cleared—segment large enough for a stable trend
-
Named owner assigned and accepted
-
Naming collision check passed
-
Parallel run completed with deltas inside tolerance
-
Row-count, aggregate, and distribution parity all verified
-
Edge-date behavior checked (first/last day, timezones)
-
Every upstream dependency traced to a permanent, owned source
-
Freshness SLA of the slowest dependency documented
-
Downstream consumers notified before go-live
If any box is unchecked, the metric stays an experiment metric. That's not bureaucracy—it's the difference between a KPI people trust and one that quietly poisons a quarter of planning.
The reason experiment metrics alignment fails so often isn't a skill problem. It's that the promotion moment feels like a formality—copy the query, point the dashboard, done. But an experiment metric and a production KPI are different animals wearing the same name, and the gap between them is exactly where undocumented filters, dead upstream tables, and timezone bugs slip through.
The parallel-run verification is worth adopting even if you skip everything else here. Prove the two numbers agree before you trust the new one. Everything else—canonical mapping, guardrails, lineage checks—exists to explain the deltas when they don't agree, which happens more often than you'd expect. If you're also wrestling with the reporting side of this, particularly recurring cohort-style metrics that tend to get reinvented per-experiment, our analyst workbook on weekly cohort retention without SQL pairs well with this—it covers how to standardize the kind of recurring metric that most often gets sloppily promoted out of a one-off test.
Ready to elevate your business intelligence?
Join 2,500+ businesses leveraging Glasaly to drive smarter decisions, improve team alignment, and boost operational performance.