

Most analysts spend Monday mornings rebuilding the same retention cohort tables in Excel. Export user data, pivot by signup week, calculate percentages, paste into the dashboard template, realize the date ranges are wrong, start over. By 11am, you're finally looking at last week's numbers.
The frustrating part? You know exactly what you need to track. You understand cohort analysis better than anyone. You just don't have engineering resources to build a proper pipeline, and the BI tools your company uses require SQL knowledge you either don't have or don't have time to write every week.
This workbook approach cuts the manual rebuild from 3 hours to about 20 minutes. More importantly, it creates consistent retention matrices that don't break when someone joins mid-week or when accounting adjusts billing dates.
The retention tracking mess that happens without proper structure
Weekly retention analysis usually looks like this:
You pull user signups from whatever system holds that data—maybe Stripe, maybe your CRM, maybe a CSV export from the production database. You group users by their signup week. Then you track whether they performed your key action (logged in, made a purchase, posted content) in subsequent weeks.
Simple enough, except every Monday you realize Marketing ran a campaign that started Tuesday, not Monday, so the cohort boundaries feel wrong. Some users signed up at 11:58 PM Sunday and got grouped into the wrong week. The finance team wants calendar months but product wants rolling 7-day windows. Your Week 3 retention for the January 15th cohort shows 102% because of duplicate entries.
The core problem isn't the math. Retention calculation is straightforward. The problem is that without a consistent framework for event selection and cohort window design, you're reconstructing your methodology from scratch every time.
Event selection: picking signals that actually indicate retention
Before touching any data, you need to define two events clearly:
Stop missing critical business insights.
Glasaly helps you create, share, and track interactive dashboards effortlessly.
- Real-time data visualization
- Collaborative report sharing
- Customizable analytics widgets
No credit card required
The cohort-defining event: What action places someone in a cohort? For SaaS products, this might be account creation. For marketplaces, first purchase. For content platforms, first post.
The retention event: What action indicates they're still engaged? This is where most analyses fall apart.
A fitness app initially tracked "app opens" as their retention event. Their 4-week retention looked amazing—around 67%. But revenue was declining. Turns out people were opening the app, seeing the home screen, and immediately closing it. When they switched to tracking "workout completed," retention dropped to 23%, but now the metric actually correlated with subscription renewals.
The workbook approach starts with an Event Definition Sheet:
| Event Type | Specific Action | Data Source | Timestamp Field | Unique Identifier |
|---|---|---|---|---|
| Cohort Entry | Account created | Postgres export | created_at | user_id |
| Retention Signal | Posted content | Activity logs | action_timestamp | user_id |
| Alternative Signal | Logged in | Auth logs | login_time | user_id |
Notice the Alternative Signal row. Always track a secondary retention event. You'll need it when stakeholders inevitably ask "but what if we measured it differently?"
Cohort window design that handles edge cases
The most common retention mistake is inconsistent cohort windows. Week 1 might be 7 days for some cohorts but 6 or 8 days for others, depending on when months end or when you pulled the data.
Fixed calendar windows eliminate these issues: Every cohort starts Monday 00:00:00 and ends Sunday 23:59:59. No exceptions. If someone signs up Sunday at 11:45 PM, they're in that week's cohort, even if they only had 15 minutes in their "first week."
Relative day counting: Day 0 is signup day. Week 1 is days 0-6. Week 2 is days 7-13. This seems obvious until you realize half your historical analyses probably mixed these up.
Create a Cohort Calendar tab in your workbook:
Cohort Week: Jan 15-21, 2024
-
Monday Jan 15
Day 0 for Monday signups
-
Tuesday Jan 16
Day 0 for Tuesday signups
-
Sunday Jan 21
Day 0 for Sunday signups
Week 1 retention window: Jan 22-28 Week 2 retention window: Jan 29-Feb 4 Week 3 retention window: Feb 5-11
This visual calendar prevents the "wait, which week are we measuring?" confusion that derails Monday morning meetings.
Building the retention matrix without complex formulas
The actual retention matrix doesn't require VLOOKUP mastery or nested IF statements.
Start with three tabs:
-
Raw Events (your data export)
-
Cohort Assignment
-
Retention Matrix
In the Cohort Assignment tab, create columns for User ID, Signup Date, Cohort Week (use WEEKNUM or simple date math), Days Since Signup (TODAY() - Signup Date), and Current Week Number (Days Since Signup / 7, rounded down).
Week 1 Retention = COUNTIFS( cohortweek = targetweek, actionweek = targetweek + 1, userid = unique ) / COUNT(cohortweek = target_week)
The breakthrough here is maintaining a separate "Action Weeks" sheet where you pre-calculate which week each retention event occurred in. This turns your retention matrix into simple division operations instead of date range matching.
The lightweight automation that changes everything
Manual process has too many failure points. You export from three different systems. You paste into Excel. You adjust date formats. You run your pivots. You copy to the dashboard. Each step introduces potential errors.
A lightweight automation setup looks like this: Start with a data connection layer instead of manual exports—set up automated pulls from your key systems. Most modern platforms offer webhook or API access that can dump to Google Sheets automatically.
Then build a processing script using simple Google Apps Script or Python notebook that reads the raw data, applies your cohort definitions, calculates retention percentages, and outputs to your standard matrix format.
Here's a simple workflow to automate the pulls and processing.
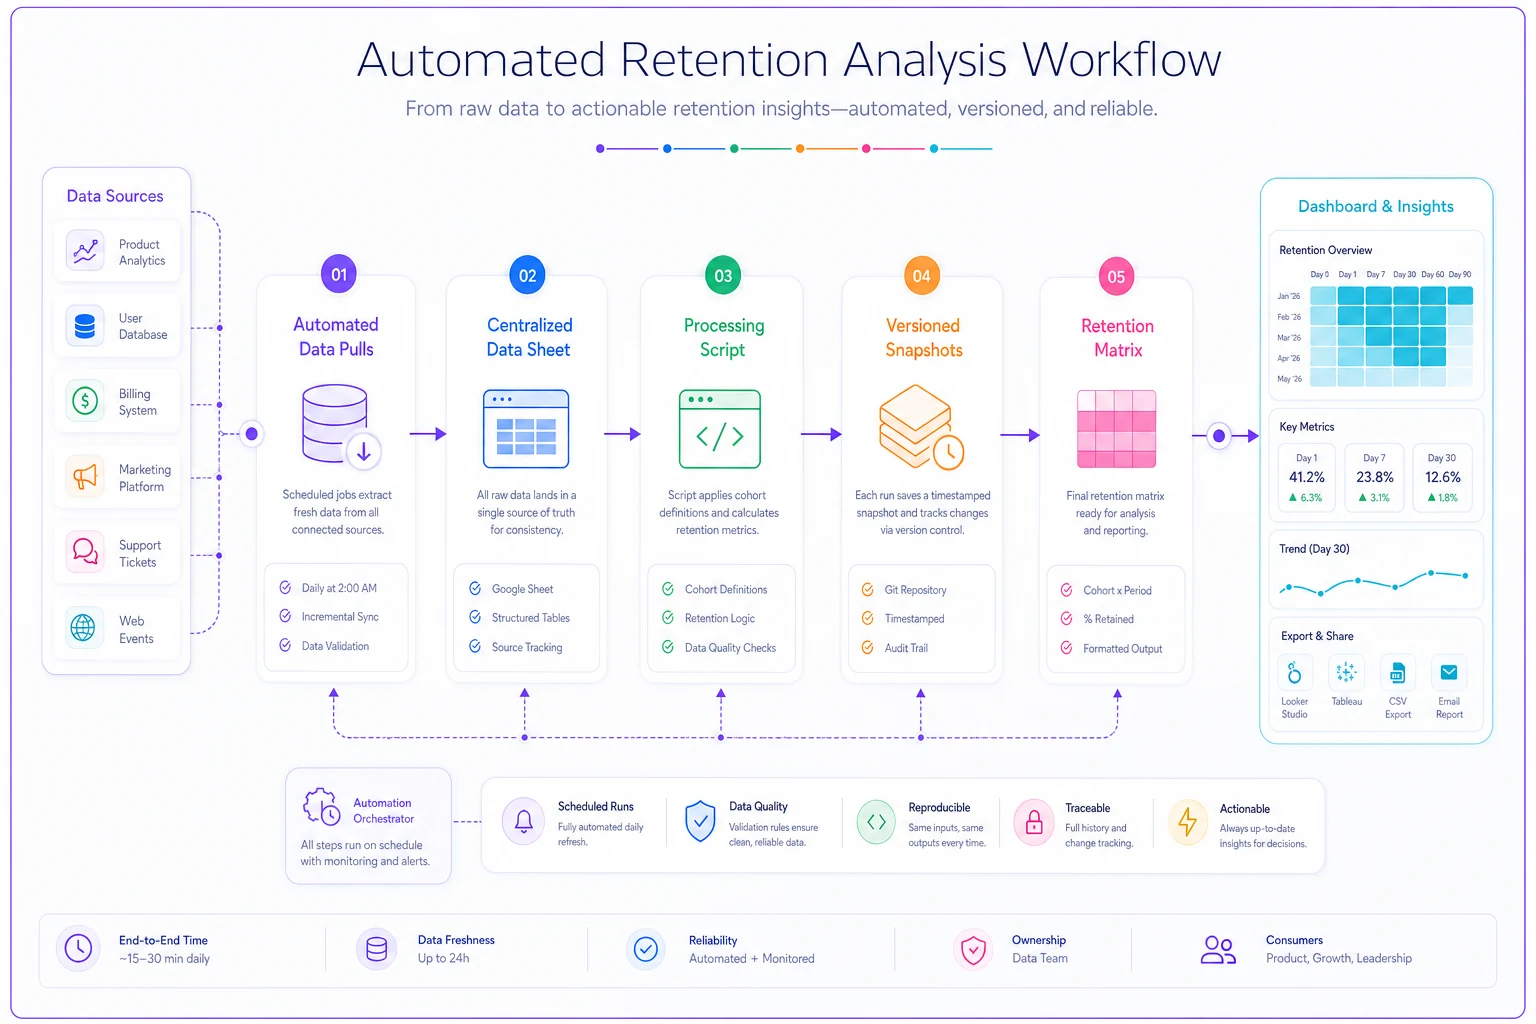
Keep historical snapshots. Every week's matrix gets saved with a timestamp. When someone asks why retention changed, you can show exactly when it happened.
The setup takes about 4 hours initially but saves 2-3 hours every single week afterward. For a retention analysis you're running weekly, that's 100+ hours saved annually.
This is where operational software enhanced with AI automation makes the biggest difference. Instead of manually coordinating data from multiple sources and rebuilding matrices each week, AI-powered workflow automation can handle the data collection, processing, and matrix generation—while maintaining your exact methodology and handling edge cases consistently.
Real example: marketplace retention tracking
An online tutoring marketplace tracked retention wrong for 8 months before catching it. They measured "tutor session booked" as their retention event but counted from student signup date. The problem: most students browsed for 3-4 days before first booking.
Their Week 1 retention showed 12%. Seemed terrible. But when they shifted to cohorts based on "first session completed" and tracked "second session booked," retention jumped to 47% in Week 1. The business hadn't changed—they were just measuring the wrong starting point.
After implementing the workbook approach, Monday analysis time dropped from 3.5 hours to 45 minutes. Retention accuracy improved after they caught duplicate counting that inflated numbers by ~15%. Stakeholder trust increased—no more "these numbers look off" discussions.
They eventually automated the pipeline entirely, but even the manual workbook version transformed their analytics workflow.
The weekly automation checklist
If you're setting this up for the first time, break it down like this:
Week 1: Event and cohort definition
-
Document your cohort entry event
-
Choose primary retention signal
-
Pick backup retention signal
-
Create cohort calendar for next 8 weeks
Week 2: Build the workbook
-
Set up three-tab structure
-
Create cohort assignment formulas
-
Build retention matrix template
-
Test with historical data
Week 3: Run parallel process
-
Keep existing analysis method
-
Run new workbook approach alongside
-
Compare results, identify discrepancies
-
Document any adjustments needed
Week 4: Automate data pulls
-
Set up API connections or exports
-
Create simple processing script
-
Test automation with Week 3 data
-
Schedule weekly runs
The companies that succeed with retention analysis aren't the ones with the most sophisticated data infrastructure. They're the ones with consistent, well-documented processes that anyone on the team can run.
Why most retention analyses fail (and how to prevent yours from joining them)
The biggest retention analysis failures happen not from calculation errors but from process breakdown.
Scenario 1: The definition drift. Month one, you measure "any activity." Month two, someone suggests focusing on "meaningful activity." Month three, finance wants "revenue-generating activity." Now your historical comparisons are worthless.
Scenario 2: The edge case explosion. US holidays throw off your weekly cohorts. International users operate on different week definitions. Payment processing delays shift when revenue actions get recorded. Each edge case gets a manual adjustment until no one remembers all the rules.
Scenario 3: The context loss. The analyst who built the retention tracking leaves. New analyst can't figure out why certain filters exist. They "simplify" the process. Three months later, someone notices retention trending wrong.
The workbook approach with lightweight automation prevents these through written documentation in the workbook itself, consistent methodology that doesn't rely on tribal knowledge, automated processes that enforce standardization, and version control that preserves historical context.
The practical reality of retention tracking
Building perfect retention tracking infrastructure would be ideal. Having engineering resources to create real-time cohort analytics would be amazing. But most operations teams need retention insights now, not after Q3's engineering roadmap.
This workbook approach works because it acknowledges the reality: analysts need to track retention with the tools and access they currently have. Excel or Google Sheets, some API access or CSV exports, and maybe basic scripting ability.
The progression usually looks like this: Months 1-2 involve manual workbook process, learning the methodology. Months 3-4 bring basic automation of data pulls. Months 5-6 introduce full automation with scheduled runs. Month 7+ sees integration with company BI tools.
Each stage provides value immediately while building toward a more sophisticated solution.
When retention tracking becomes a 20-minute Monday morning task instead of a half-day scramble, teams actually use the data. They spot trends faster, test hypotheses quicker, and make better decisions about user engagement. That's when retention analysis shifts from a reporting burden to an operational advantage.
Ready to elevate your business intelligence?
Join 2,500+ businesses leveraging Glasaly to drive smarter decisions, improve team alignment, and boost operational performance.