
Amazon just got ordered to bargain with a union at their California facility. Reuters reported this week that an NLRB judge reinforced rulings that could expand bargaining obligations across large employers. Your CEO probably forwarded you the article with one question: "Are we prepared for this?"
Honestly? Most operations teams aren't tracking the right signals.
Labor organizing doesn't announce itself with a press release. It shows up in your data weeks or months before any formal filing. Shift swap requests spike. Overtime acceptance drops. Break room incidents tick upward. Safety reports get more detailed. These aren't random fluctuations—they're early indicators that workforce sentiment is shifting.
What's frustrating is that companies spend millions on demand forecasting models while their labor risk dashboards are basically Excel sheets someone updates monthly. When unionization activity accelerates—and current legal momentum suggests it will—that gap between your predictive capabilities and your workforce analytics becomes an operational crisis.
The analytics stack nobody builds until it's too late
Most businesses track labor costs. Few track labor risk.
There's a real difference. Labor cost tracking tells you what happened last quarter. Labor risk analytics tells you what might happen next quarter. One is accounting. The other is operational intelligence.
A distribution center I worked with discovered this distinction the hard way. They had solid dashboards showing cost per package, productivity by shift, even predictive maintenance for their conveyor systems. Zero visibility into emerging workforce patterns. When organizing activity started, they were completely blind until formal notice arrived. By then, their options were limited and expensive.
The problem runs deeper than missing dashboards. Traditional workforce analytics focuses on productivity metrics—units per hour, attendance rates, overtime costs. These matter for efficiency but tell you nothing about workforce stability. You need a different analytical framework to spot emerging labor risks.
Think about your current reporting. Do you track changes in voluntary overtime participation rates by department? Correlation between supervisor turnover and subsequent team dynamics? Time-to-resolution patterns for workplace complaints? Geographic clustering of safety reports or grievances? Probably not—because these aren't standard KPIs. They're leading indicators of labor instability that only matter when organizing activity emerges, at which point building the analytics infrastructure takes weeks while events move in days.
Building your unionization operational analytics framework
Forget standard HR dashboards. Unionization risk analytics requires tracking operational patterns, not just people metrics.
Stop missing critical business insights.
Glasaly helps you create, share, and track interactive dashboards effortlessly.
- Real-time data visualization
- Collaborative report sharing
- Customizable analytics widgets
No credit card required
Start with communication velocity. When organizing begins, informal communication explodes. Break room conversations run longer. Digital chatter moves to encrypted channels. You can't monitor private conversations (and shouldn't try), but you can track proxy metrics. Badge swipe patterns show extended break room presence. Parking lot camera data reveals gathering patterns. IT logs show shifts in collaboration tool usage.
You can't monitor private conversations (and shouldn't try), but you can track proxy metrics. Badge swipe patterns show extended break room presence. Parking lot camera data reveals gathering patterns. IT logs show shifts in collaboration tool usage.
One logistics company tracked badge data and noticed their warehouse workers were arriving 20 minutes early but not clocking in—classic organizing behavior. They weren't trying to stop it; they wanted lead time to prepare operationally. That's the difference between surveillance and operational intelligence.
From there, build your sentiment velocity dashboard. Not some fancy NLP model scanning emails—operational data that reflects workforce mood:
| Metric Category | Traditional View | Risk Signal View |
|---|---|---|
| Safety Reports | Incident frequency | Report detail depth and language tone |
| Overtime | Hours and cost | Voluntary acceptance rate changes |
| Scheduling | Coverage gaps | Shift swap request patterns |
| Complaints | Resolution time | Geographic and temporal clustering |
| Turnover | Department rates | Influence network effects |
Use badge swipe aggregates rather than individual logs to detect gathering patterns without invading privacy.
Individual metrics show noise. Combined patterns show risk.
A manufacturing client found that unionization risk followed a consistent pattern across four locations over two years: safety report detail increased around 40% roughly eight weeks before organizing activity became visible. Voluntary overtime dropped about 25% at week six. Shift swap requests clustered by department at week four. By week two, turnover in key roles spiked. Not a coincidence.
SLOs that actually matter during labor uncertainty
Service level objectives for labor risk look nothing like your typical operational SLOs.
Standard SLOs focus on system performance: uptime, response times, error rates. Labor risk SLOs focus on detection speed and response capability:
-
Time to detect 20% deviation in workforce behavioral patterns
<5 days
-
Dashboard refresh rate during active negotiations
<4 hours
-
Scenario model generation for labor cost changes
<2 hours
-
Cross-functional alert distribution for risk signals
<30 minutes
These aren't arbitrary targets. Each represents a critical operational capability during labor uncertainty.
The detection window matters because organizing typically follows a 60-90 day trajectory from initial activity to formal filing. Missing the first 30 days means you're perpetually reactive. Five-day detection gives you roughly seven weeks to prepare—enough time to stress-test schedules, validate contingency plans, and align leadership.
Dashboard refresh rates become critical during active negotiations. Labor discussions can shift hourly. Your Thursday morning metrics might be obsolete by Thursday afternoon. Companies managing negotiations with weekly reports are essentially making million-dollar decisions on stale data.
The scenario modeling SLO might seem aggressive, but consider the alternative. A union proposes new overtime rules. Finance needs cost projections. Operations needs coverage analysis. Legal needs compliance verification. Without rapid scenario modeling, these groups work from different assumptions, creating chaos when you need coordination most.
Scenario models that bridge negotiation tables and loading docks
Most scenario planning for labor negotiations happens in spreadsheets that would make you weep. Complex IF statements nested six levels deep. Manual updates that take days. Version control that's basically "BudgetFinalFINALv2REALLY_FINAL.xlsx."
Modern unionization operational analytics requires dynamic scenario modeling that connects negotiation proposals to operational reality in hours, not weeks.
The framework that actually works:
-
Direct cost modeling — Base wage adjustments by role and seniority, overtime multiplier changes, benefit cost modifications, shift differential updates.
-
Operational constraint modeling — Minimum staffing requirements under new rules, break and meal period coverage gaps, consecutive day/hour limitations, seniority-based scheduling restrictions.
-
Cascading impact modeling — Productivity changes from modified schedules, customer service level impacts, inventory carrying cost adjustments, third-party contractor requirements.
-
Competitive response modeling — Market share risks from cost disadvantages, customer switching probability at new price points, competitor wage pressure responses, talent acquisition difficulty adjustments.
A food distribution company used this framework during recent negotiations. The union proposed seemingly reasonable overtime changes—time-and-a-half after 8 hours daily instead of 40 hours weekly. Their static spreadsheet showed a 3% cost increase.
The dynamic model revealed the real impact: closer to 11% when you factored in peak-season scheduling patterns, driver availability constraints, and customer delivery windows. The negotiation team could show exactly why the proposal was operationally problematic, using real data instead of just saying "too expensive."
The Wednesday morning surprise: when negotiations accelerate without warning
Negotiations don't follow project plans. Wednesday morning everything's calm. Wednesday afternoon the union announces a strike vote for Friday. Thursday becomes the longest day of your operational career.
This is when your analytics infrastructure either saves you or sinks you.
Traditional reporting cycles assume predictability—monthly reviews, weekly updates, daily summaries. Labor negotiations laugh at your reporting calendar. You need analytics that can pivot from monitoring mode to crisis mode in minutes.
That shift requires three capabilities most teams don't have.
Rapid data marshaling: Your workforce data probably sits in six different systems. HR has headcount and costs. Operations has schedules and productivity. Finance has budgets and forecasts. IT has badge and system access logs. Safety has incident reports. Legal has complaint records. During crisis mode, you need unified visibility in hours, not the weeks it usually takes to reconcile these sources.
Stakeholder-specific views: The CEO needs different information than the warehouse manager. Legal cares about compliance risks. Finance obsesses over margin impacts. Operations focuses on coverage gaps. Your unified dataset needs to fragment into role-specific dashboards fast. Generic reports waste precious time during crisis response.
Hypothesis testing speed: Someone suggests hiring temporary workers. How many? What skills? Which shifts? At what cost? For how long? Traditional analysis would take days. During negotiations, you might have two hours before the next meeting. Your analytics platform needs to test operational hypotheses at the speed of conversation.
The scenario generation workflow during active negotiations looks roughly like this:
This diagram captures the rapid scenario generation flow used during active negotiations.
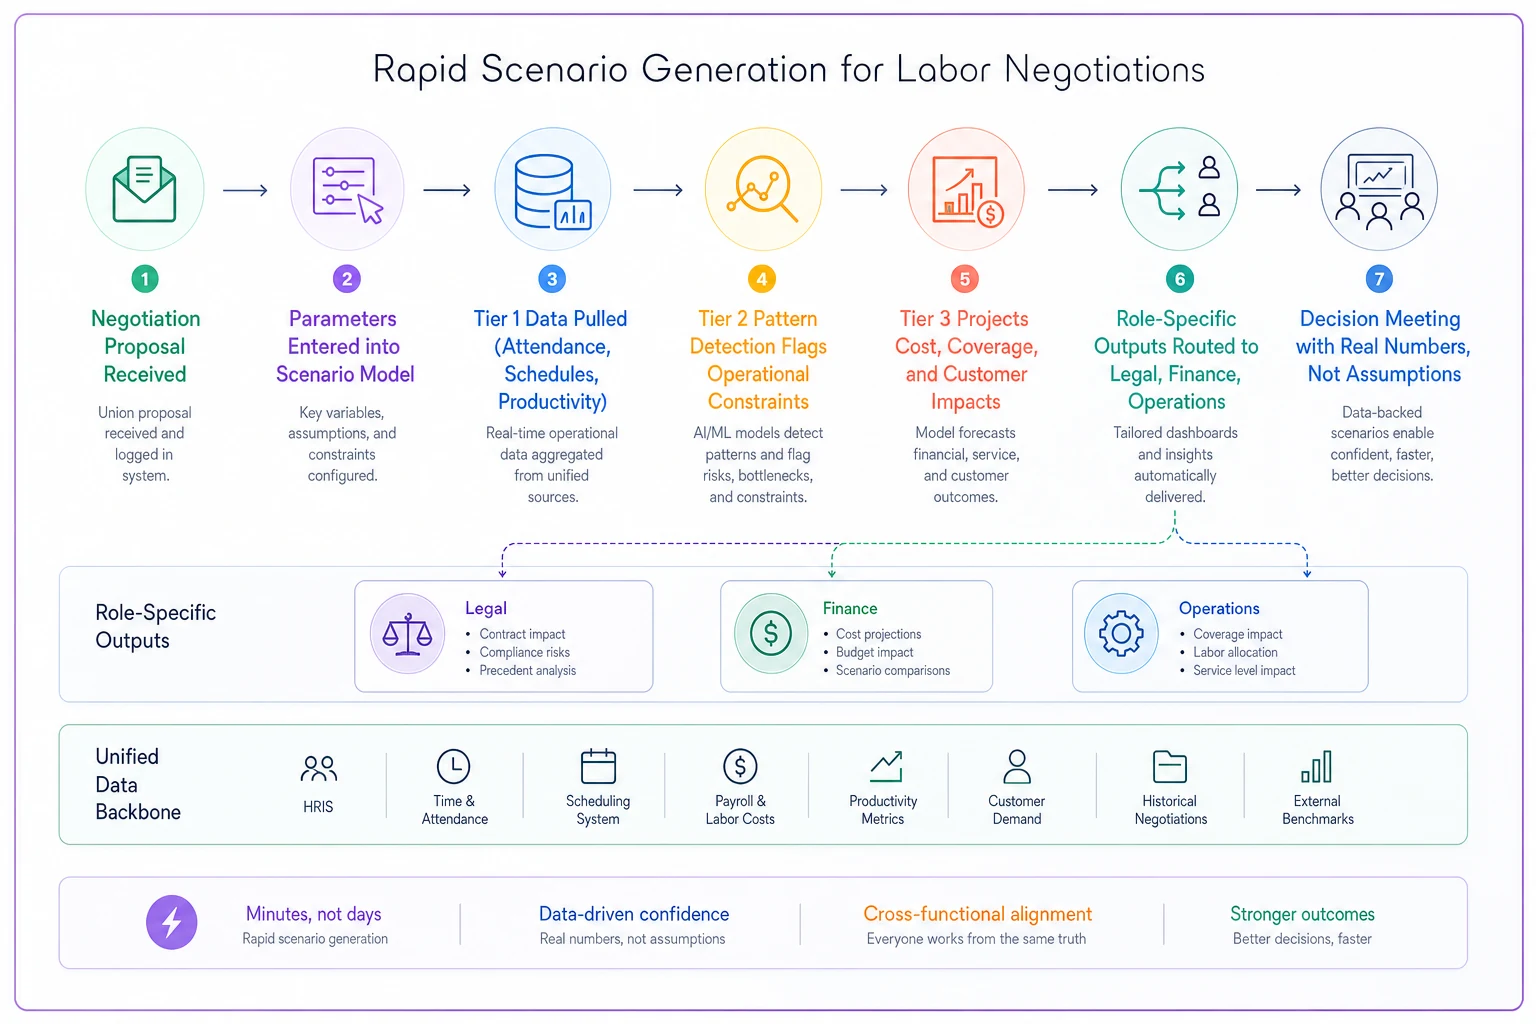
Negotiation proposal received ↓ Parameters entered into scenario model ↓ Tier 1 data pulled (attendance, schedules, productivity) ↓ Tier 2 pattern detection flags operational constraints ↓ Tier 3 projects cost, coverage, and customer impacts ↓ Role-specific outputs routed to legal, finance, operations ↓ Decision meeting with real numbers, not assumptions
Converting analytics into operational decisions (not just pretty charts)
Analytics without decisions is expensive entertainment.
The gap between insight and action kills most labor risk responses. You identify a risk signal. You generate visualizations. You distribute comprehensive reports. Then nothing happens—because nobody knows what to do with the information.
Role-specific decision frameworks close that gap. Don't just tell operations that overtime acceptance dropped 30%. Tell them exactly what to do about it.
For the operations manager:
-
Immediately audit next week's schedule for coverage risks
-
Contact top performers personally to confirm availability
-
Prepare contingency schedules using contractor options
-
Document any service level impacts for customer communications
For the finance lead:
-
Update weekly cash flow projections for overtime scenarios
-
Model margin impact at 25%, 50%, and 75% contingency staffing
-
Identify which customer contracts allow price adjustments
-
Prepare board-level risk disclosure if material
For the HR partner:
-
Review recent exit interview themes for negotiation priorities
-
Accelerate pending promotions for key retention risks
-
Prepare communication templates for various scenarios
-
Validate legal compliance of contingency staffing plans
These aren't suggestions—they're triggered workflows based on specific analytic thresholds. When your unionization operational analytics platform detects a signal, it should generate role-specific action items, not just alerts.
This connects directly to embedding analytics into daily operations, but labor negotiations require much tighter integration. You're not optimizing efficiency—you're maintaining operational continuity under extreme uncertainty.
Platform architecture for labor risk analytics
Building this isn't trivial, but it's not rocket science either.
The core challenge is connecting disparate operational data sources while maintaining security and compliance. Labor data is sensitive. Negotiations are confidential. Your architecture needs to balance transparency with protection.
Start with a data lake approach—don't try to build a unified schema upfront. Labor negotiations surface unexpected data needs. That five-year-old safety system you never integrated? Suddenly critical. The badge reader logs nobody ever analyzed? Now they're gold.
Layer your analytics in three tiers:
Tier 1: Operational baseline Automated data collection from core systems. No human interpretation, just facts. Attendance rates, productivity metrics, scheduling patterns, safety reports. This tier updates continuously and feeds everything above it.
Tier 2: Pattern detection Statistical models looking for deviations from baseline. Not AI magic—straightforward analytics that flag when patterns shift beyond normal variation. Think control charts, not neural networks. Complexity adds fragility when you need reliability most.
Tier 3: Scenario modeling Dynamic models that accept negotiation parameters and project operational impacts. This tier requires the most sophistication but delivers the highest value. It transforms negotiation proposals from abstract concepts into operational realities.
The key is keeping these tiers loosely coupled. When negotiations heat up, you'll need to modify Tier 3 rapidly without breaking Tier 1 data flows. When new data sources emerge, you'll integrate them into Tier 1 without rebuilding Tier 2 detection logic. The architecture should feel boring on purpose—boring means stable when things get chaotic.
The metrics that nobody tracks until it's too late
Every company tracks employee turnover. Almost none track influence-weighted turnover.
Not all employees are equal when it comes to organizing influence. The quiet warehouse veteran who everyone respects matters more than ten new hires. The break room storyteller who shapes opinions carries more weight than any supervisor. When these influence nodes leave, the social dynamics shift.
One distribution center learned this painfully. They celebrated keeping turnover under 15%—solid retention by industry standards. What they missed: three influential employees left within two weeks. All three were informal team leaders who shaped workplace culture. Six months later, organizing activity erupted in their exact departments.
Building influence metrics requires combining formal and informal indicators:
-
Formal
tenure, role, shift leadership positions
-
Informal
break room patterns, parking lot gatherings, internal reference networks
A simple proxy: track who gets asked questions during shift changes. These information brokers often hold outsized influence. When they leave, communication patterns fragment, creating the uncertainty that organizing efforts can exploit.
Another ignored metric is resolution velocity degradation. Every operation has a baseline speed for resolving workplace issues—schedule changes, equipment problems, safety concerns. When that resolution speed degrades by 20% or more, workforce frustration accumulates. It's like pressure building in a pipe, invisible until it bursts. Most operations teams see the burst and never notice the pressure buildup that preceded it.
Preparing for the scenario you hope never happens
Strike contingency planning without data is just creative writing.
You need three models ready before negotiations even start:
Model 1: Graduated service degradation What services can you maintain at 75% staffing? 50%? 25%? This isn't linear—losing 25% of your workforce might mean losing 40% of your capacity if they're concentrated in critical roles. Your model needs to account for skill distributions, not just headcount.
Model 2: Customer impact cascades Which customers leave first when service degrades? What's the recovery time for different service level drops? Some customers tolerate occasional disruption. Others switch providers after one bad experience. Your analytics need customer-specific tolerance models.
Model 3: Competitive exploitation windows How quickly can competitors capture your disrupted volume? What's their capacity to absorb your customers? How long before temporary switches become permanent? This intelligence shapes how aggressively you can negotiate.
A regional retailer built these models before negotiations and discovered something important: their contingency plan would hold for about 72 hours. After that, competitor capacity constraints would disappear and customer defection would accelerate. That insight completely changed their negotiation strategy—they knew exactly how long they could withstand disruption, which is more useful than any amount of general preparation advice.
The AI automation layer for labor negotiations
Manual analytics during labor negotiations is a losing battle.
Events move too fast. Data sources multiply. Stakeholder demands explode. Your analysts can't keep up with manual processes. This is where AI-assisted operational platforms prove their value—not replacing human judgment but amplifying human capacity.
Consider notification routing. During normal operations, threshold alerts go to designated owners. During negotiations, the same alert might need to reach legal, operations, finance, and HR simultaneously. AI automation can dynamically adjust routing based on negotiation status, ensuring critical signals reach the right people without someone manually maintaining a distribution list.
Or take scenario modeling. Humans define the scenarios, but automation can generate hundreds of variations in minutes. What if overtime rules change AND minimum staffing increases AND shift differentials adjust? Manual modeling would take days. Automated modeling delivers answers during the meeting where questions arise.
The key is focusing AI on acceleration, not decision-making. Use it to detect patterns faster than human review, generate scenario variations at scale, route information based on context, summarize complex data for executives, and track compliance with negotiation agreements.
One logistics company reduced their scenario modeling time from roughly three days to a few hours using AI-assisted platforms. Not full automation—humans still defined parameters and validated outputs. But the mechanical work of running calculations, generating visualizations, and formatting reports? That's where automation actually earns its keep.
Beyond the negotiation table
Labor uncertainty isn't going away. The legal landscape keeps shifting. Workforce expectations keep evolving. Competition for talent intensifies. Companies that treat unionization operational analytics as a one-time project will find themselves perpetually unprepared.
The smarter move is building these capabilities into your standard operational platform. The same patterns that detect unionization risk can identify retention problems, productivity barriers, and culture shifts before they become expensive. The scenario models built for negotiations can optimize regular scheduling and staffing decisions. The rapid response frameworks developed for crisis can accelerate all kinds of operational decisions.
Think of it as operational infrastructure that pays dividends even if you never face organizing activity.
The Amazon ruling this week won't be the last surprise. Legal precedents will keep evolving. Workforce dynamics will keep shifting. The question isn't whether you'll face labor uncertainty—it's whether you'll see it coming in time to respond effectively.
Start with the basics: unified workforce data, role-specific dashboards, and simple scenario models. Build from there. Perfect analytics tomorrow won't help if negotiations start today. The gap between labor headlines and operational reality is measured in weeks, not quarters—and your analytics infrastructure needs to operate at that speed, or you'll always be reacting to someone else's timeline.
Labor uncertainty isn't going away. The legal landscape keeps shifting. Workforce expectations keep evolving. Competition for talent intensifies. Companies that treat unionization operational analytics as a one-time project will find themselves perpetually unprepared.
The smarter move is building these capabilities into your standard operational platform. The same patterns that detect unionization risk can identify retention problems, productivity barriers, and culture shifts before they become expensive. The scenario models built for negotiations can optimize regular scheduling and staffing decisions. The rapid response frameworks developed for crisis can accelerate all kinds of operational decisions.
Think of it as operational infrastructure that pays dividends even if you never face organizing activity.
Ready to elevate your business intelligence?
Join 2,500+ businesses leveraging Glasaly to drive smarter decisions, improve team alignment, and boost operational performance.