

Most analytics teams spend weeks building perfect dashboards that nobody looks at during actual decision moments. A logistics company I worked with lost $47k in one quarter because their inventory metrics lived in a separate system from their purchasing workflow. The ops manager made daily ordering decisions based on gut feel while beautiful charts sat unused in another browser tab.
The gap between having data and using data at decision points kills more operational improvements than any technical limitation. You can have real-time pipelines, ML models, automated reports—but if your sales rep doesn't know which metric to check before offering a discount, or your support lead can't access churn signals during an escalation call, you're just producing expensive wallpaper.
The decision-to-data disconnect pattern
Teams build centralized dashboards assuming people will naturally check them before making decisions. They don't.
A typical sequence: Analytics team launches a new revenue dashboard. Sales managers get trained on it. Two weeks later, deal negotiations happen based on memory of last month's numbers. Support escalates issues without checking customer health scores. Operations adjusts staffing using outdated spreadsheets instead of the real-time utilization metrics sitting in Tableau.
The fundamental mistake is treating analytics as a destination rather than embedding it into existing workflows. People make decisions where they work—in their CRM during calls, in Slack during escalations, in spreadsheets during planning. If the data isn't there at that exact moment, it might as well not exist.
This gets worse as organizations grow. At 10 employees, everyone knows the key numbers. At 50 employees, tribal knowledge breaks down but formal systems aren't established yet. At 200 employees, you have sophisticated analytics that nobody uses consistently because there's no operational analytics playbook connecting decisions to data.
Why role-specific playbooks beat universal dashboards
Universal dashboards assume everyone needs the same information presented the same way. But a support agent handling an escalation needs completely different data than an ops manager planning next week's capacity. The support agent needs immediate access to that customer's history, recent tickets, and account value. The ops manager needs trend data, capacity projections, and cost implications.
Stop missing critical business insights.
Glasaly helps you create, share, and track interactive dashboards effortlessly.
- Real-time data visualization
- Collaborative report sharing
- Customizable analytics widgets
No credit card required
Generic dashboards force users to hunt for relevant information during time-sensitive decisions. Role-specific playbooks map exact data needs to exact decision moments. Instead of "here's all our data, figure out what you need," it becomes "when you're doing X, check Y metric using Z tool."
A B2B software company with around 140 employees had 47 different dashboards that product, sales, and customer success could theoretically access. Actual usage? Sales checked their pipeline dashboard weekly. Support never opened the customer health dashboard. Product looked at feature usage quarterly for planning.
After implementing decision-specific playbooks, the same teams started referencing data multiple times daily. Not because they suddenly cared more about metrics, but because the data appeared exactly when and where they needed it.
Building the operational analytics playbook framework
A functional playbook maps every significant decision point to its required data, access method, and escalation path. This isn't documentation for documentation's sake—it's an operational tool that lives where work happens.
Start with decision inventory by role. For operations managers, this might include:
-
Daily staffing adjustments
-
Vendor reorder triggers
-
Capacity planning calls
-
Exception handling
-
Budget variance reviews
For each decision, the playbook specifies:
Trigger: What initiates this decision (time-based, threshold, request, event)
Required data artifacts: Specific metrics, reports, or analyses needed
Access path: Exact steps to retrieve the data (which system, what filters, what view)
Decision criteria: Thresholds, benchmarks, or rules that guide the choice
Documentation: Where and how to record the decision
Escalation: When to involve others and who specifically
Example: Support Escalation Decision
| Decision Element | Specification |
|---|---|
| | Trigger | | Customer threatens to cancel during support interaction |
| | Required data | | Customer lifetime value (CRM → Account Overview)<br>Recent ticket history (Support tool → Customer Timeline)<br>Product usage last 30 days (Analytics → User Activity Report)<br>Contract renewal date (CRM → Subscription Details) |
| | Decision criteria | | If CLV > $25k annual: Immediate escalation to Customer Success lead<br>If recent tickets > 5 in past month: Include product team<br>If usage dropped > 40%: Flag for retention offer |
| | Documentation | | Log in CRM escalation notes with decision reasoning |
| | Escalation path | | Support → CS Lead → VP Customer Success (if > $50k CLV) |
The difference from traditional documentation: this lives in the support team's daily tools, not in a wiki they'll never check. It's embedded in their ticketing system, available through shortcuts, and reinforced through their regular workflows.
Operations team playbooks: from reactive to predictive
Operations decisions often cascade through the entire business. A delayed vendor order affects inventory, which impacts sales, which changes cash flow. Most ops teams make these interconnected decisions using fragmented data sources.
Capacity planning decisions
-
Monday planning
Review utilization from previous week (should be 68-75% for healthy margins)
-
Staffing adjustments
Check next 5-day demand forecast before calling in additional staff
-
Overtime approval
Calculate incremental cost vs. service level impact
Inventory and supply decisions
-
Reorder triggers
When stock-days falls below 12 days based on trailing 20-day average
-
Vendor selection
Compare landed cost including delays and quality issues
-
Safety stock adjustments
Review variance patterns monthly, adjust buffers quarterly
Cost management decisions
-
Daily variance review
Any line item >8% over rolling average triggers investigation
-
Vendor performance
Monthly scorecard before renewal discussions
-
Process changes
Calculate implementation cost vs. efficiency gain
The playbook should include specific SQL queries, report links, or simple spreadsheet templates. One distribution center embedded these directly into their warehouse management system. Order pickers could see real-time productivity metrics on their scanners. Managers had threshold alerts built into their morning reports.
Sales playbooks: data at negotiation moments
Sales teams make hundreds of micro-decisions daily that impact revenue. Which lead to call first? What discount to offer? When to involve sales engineering? Yet sales analytics often lives in separate systems from where these decisions happen.
Lead prioritization
-
Morning planning
Sort by lead score AND recent engagement signals
-
Check competitor presence indicators before first call
-
Review similar won deals for talking points
Pricing decisions
-
Discount approval matrix based on deal size, competition, and quarter timing
-
Margin impact calculator embedded in quote tool
-
Historical win rate at different price points by segment
Pipeline management
-
Weekly reviews
Focus on deals with decreasing engagement scores
-
Risk indicators
No executive engagement, single-threaded, no technical validation
-
Acceleration opportunities
Which stalled deals have new triggers?
One SaaS company built these checks directly into Salesforce. Before moving a deal to negotiation stage, reps had to acknowledge competitive intelligence. Before offering discounts over 20%, they had to run the margin impact calculator. Average deal size increased 24% and discount variance dropped from 18% to 11%.
Support playbooks: escalation intelligence
Support decisions happen in seconds during live customer interactions. There's no time to switch screens, run reports, or check dashboards. The operational analytics playbook for support must deliver insights within the conversation flow.
Escalation triggers
-
Sentiment declining over multiple interactions
-
Keywords indicating cancellation intent
-
Account value crossing threshold
-
Technical issues affecting multiple users
Resolution paths
-
Product usage patterns indicating feature confusion
-
Similar tickets resolved successfully
-
Account history of credits or concessions
-
Competitive pressure indicators
Retention moments
-
Engagement dropping below account average
-
Invoice dispute patterns
-
Feature request alignment with roadmap
-
Executive stakeholder changes
Instead of requiring agents to remember complex decision trees, embed the intelligence into their tools. When certain keywords appear in tickets, automatically surface relevant account metrics. When escalation criteria are met, generate the handoff summary with all required context.
A B2B software company implemented this using simple automation between their help desk and data warehouse. Support tickets automatically pulled in account health score, recent usage trends, renewal date and value, plus key stakeholder engagement. Agents didn't need to check separate systems or remember to look up account details. First-call resolution improved by about 15% and unnecessary escalations dropped by nearly half.
Creating feedback loops that actually close
Most analytics initiatives fail to create closed feedback loops. Decisions get made, outcomes happen, but nobody connects the two to improve future decisions.
For each decision point, specify:
-
How outcomes will be measured
-
When to review decision effectiveness
-
Who owns the iteration process
-
How learnings update the playbook
Start simple:
Operations feedback loops
-
Weekly
Compare staffing decisions to actual demand
-
Monthly
Review inventory stockouts and overstock situations
-
Quarterly
Analyze vendor performance against selection criteria
Sales feedback loops
-
Won/lost analysis
Which playbook elements correlate with wins?
-
Discount effectiveness
Do larger discounts actually improve close rates?
-
Pipeline velocity
Which decisions accelerate or stall deals?
Support feedback loops
-
Escalation outcomes
Which triggers correctly identify at-risk accounts?
-
Resolution effectiveness
Do playbook paths reduce repeat tickets?
-
Customer satisfaction
Which decision points impact CSAT scores?
Build these reviews into existing meetings rather than creating new processes. Operations already has weekly planning meetings—add 10 minutes for decision review. Sales has pipeline reviews—include playbook effectiveness metrics.
Implementation roadmap for analytics-driven decisions
Rolling out operational analytics playbooks across an organization requires careful sequencing. Start with high-frequency, high-impact decisions in one department before expanding.
Phase 1: Pilot with one team (Weeks 1-4)
-
Document current decision process
-
Identify missing or hard-to-access data
-
Create simple access paths (even if manual initially)
-
Build basic feedback tracking
Phase 2: Embed into tools (Weeks 5-8)
-
Add data pulls to existing workflows
-
Create shortcuts and templates
-
Build simple alerting for trigger moments
-
Automate common data retrieval tasks
Phase 3: Expand to adjacent teams (Weeks 9-12)
-
Map decisions
-
Identify data gaps
-
Create access paths
-
Build feedback loops
A simple rollout workflow looks like this:
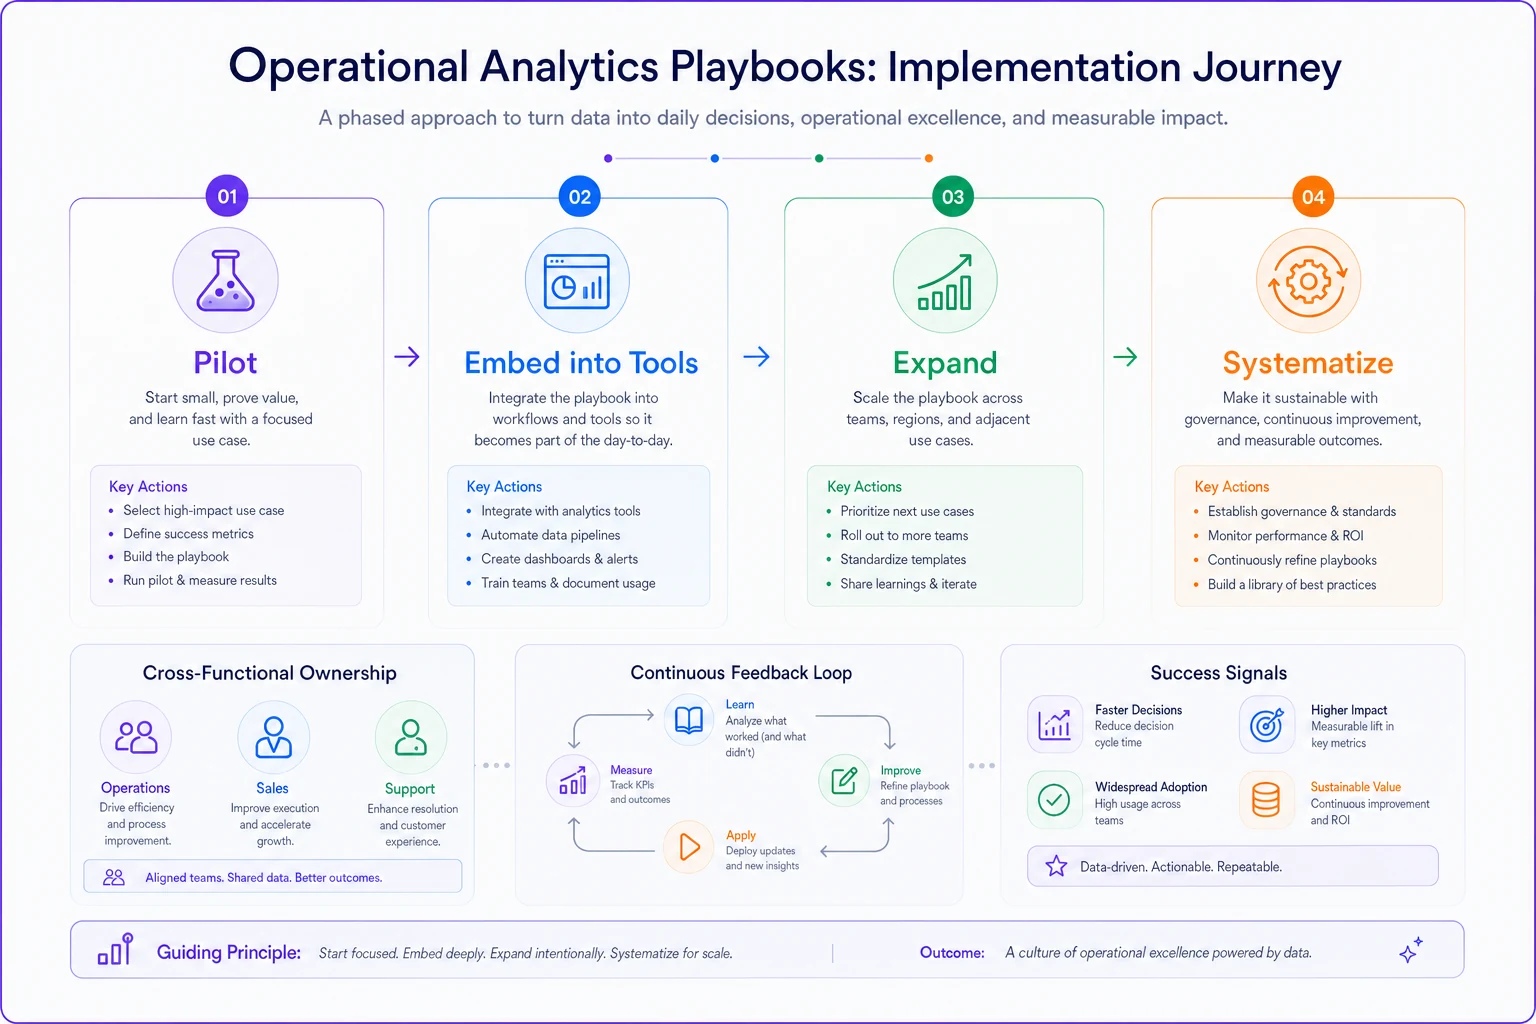
This visual summarizes the phases and feedback loops.
Phase 4: Systematize and scale (Months 4-6)
-
Standardize formats and storage
-
Build central repositories
-
Create playbook maintenance processes
-
Assign ownership for updates
This is when formal operational analytics playbook governance matters. Who updates triggers? How often do criteria get reviewed? Who approves changes?
Common failure patterns and prevention
Well-designed playbooks fail when they ignore organizational realities.
Over-engineering the initial version
Teams spend months building the perfect playbook that covers every edge case. Meanwhile, decisions continue happening without data. Start with the 20% of decisions that drive 80% of impact. A simple playbook used daily beats a comprehensive one that never launches.
Ignoring technical constraints
Your playbook might specify checking real-time inventory before ordering, but if the inventory system updates daily, you're setting teams up for failure. Design around actual system capabilities, not ideal states.
Creating separate "analytics workflows"
If using the playbook requires switching tools or additional steps, adoption drops. Embed data into existing workflows rather than creating new ones.
Missing the social dynamics
Some decisions aren't really about data. They're about relationships, politics, or intuition. Forcing analytics into these moments creates resistance. Identify which decisions truly benefit from data and focus there.
Static playbooks in dynamic operations
Business conditions change constantly. Customer behaviors shift. Competition evolves. Static playbooks become outdated quickly. Build review cycles and update triggers into the process from the start.
Measuring playbook effectiveness
You'll know your operational analytics playbook works when decisions improve without requiring extra effort.
Usage metrics
-
Percentage of decisions following playbook paths
-
Time to access required data
-
Frequency of data reference during decisions
Decision quality
-
Accuracy of predictions (staffing needs, inventory requirements)
-
Consistency across team members
-
Reduction in escalations or exceptions
Business outcomes
-
Operational efficiency improvements
-
Revenue impact from better pricing decisions
-
Customer satisfaction from faster resolutions
Team adoption
-
Self-reported confidence in decisions
-
Requests for additional playbook coverage
-
Organic sharing of playbook successes
Individual decisions vary, but patterns emerge over time.
The path from chaos to coordination
Before implementing operational analytics playbooks, one retail chain had different store managers making inventory decisions based on completely different criteria. Some used last year's sales, others used recent trends, many just guessed. The result was constant stockouts in some locations while others sat on excess inventory.
-
Check trailing 15-day sales velocity
-
Review upcoming promotions
-
Factor in local events
-
Order using standard formulas
Stockouts dropped by roughly 40% while excess inventory decreased by about 25%. New managers could make effective decisions immediately rather than learning through expensive mistakes.
This wasn't about better analytics tools or more sophisticated models. It was about connecting the right data to the right decision at the right moment.
The businesses that thrive don't just have analytics—they have analytics woven into their operational fabric. Every role knows which data matters for their decisions. Every decision point has clear data requirements. Every outcome feeds back to improve future decisions.
Start with one team, one set of decisions, one simple playbook. Build the muscle memory of checking data before deciding. Create the infrastructure for data access at decision moments. Establish the feedback loops that improve decision quality over time.
The gap between having analytics and using analytics for decisions is where most operational improvement opportunities hide. Building role-specific decision playbooks closes this gap, turning your analytics investment into actual operational advantage. The question isn't whether your organization has enough data—it's whether that data shows up when and where decisions actually happen.
Ready to elevate your business intelligence?
Join 2,500+ businesses leveraging Glasaly to drive smarter decisions, improve team alignment, and boost operational performance.