

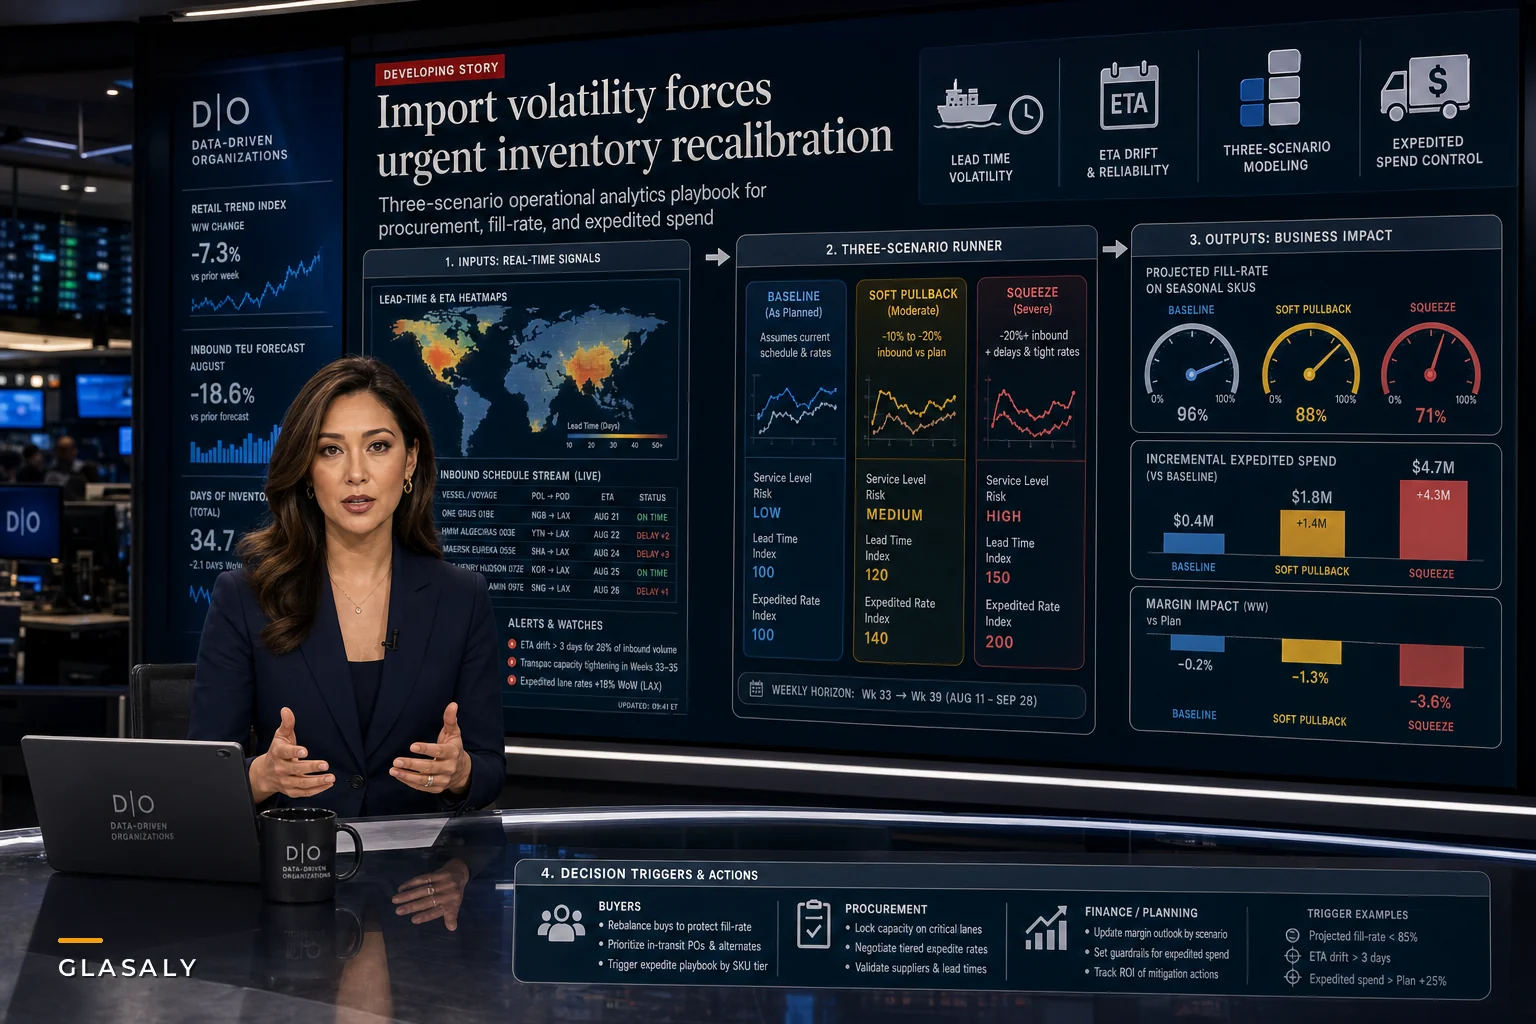

The interesting thing about this August isn't that imports are softening. It's the timing of the signal relative to the data your team is actually looking at right now.
July container volumes came in near the top of the record books — Descartes reported July as the fourth-highest month on record. But almost simultaneously, the Global Port Tracker and shippers are signaling that August volumes will pull back below year-ago levels. So you've got a strong trailing month feeding your dashboards while forward inbound is bending the other direction.
That gap — strong actuals, softening forward flow — is exactly the kind of thing that quietly breaks replenishment logic. Not because anyone made a bad call. Most inventory dashboards are backward-looking by design, and they'll keep recommending based on a volume assumption that's already stale.
This post covers what to actually change in your analytics stack over the next two to three weeks so you don't end up over-ordering into a pullback, or under-buffering going into back-to-school.
Why a "soft" import month is more dangerous than a hard one
A sharp, obvious drop in imports is easy to react to. Everybody sees it, procurement escalates, and the org mobilizes. The harder scenario is the one happening right now: volumes stay high enough that nothing looks broken on the surface, while the forward curve softens underneath.
That's the operational trap. When your trailing 8–12 weeks of receipts look healthy, your days-of-inventory and fill-rate metrics look healthy too. Safety stock formulas that lean on trailing demand and trailing lead-time variability will read the environment as calm. Meanwhile the actual risk — a lead-time drift as carriers rebalance capacity, or a supplier pushing a shipment two weeks because their own bookings thinned out — never shows up until the receipt doesn't land.
The damage in a soft-pullback month is almost always concentrated in a handful of SKUs, not spread evenly. It's the seasonal items with tight sell-through windows and the long-lead imports where a single missed container flips you from comfortable to expediting everything. The blended dashboard hides it because the averages stay fine.
So the first mental shift: stop trusting aggregate days-of-inventory this month. You want per-SKU, per-lane visibility on anything seasonal or long-lead, and you want it before the numbers turn.
The three dashboards that need surgery first
Before touching scenario models, fix what analysts and buyers are already staring at every morning. These three are where bad decisions get made during volatile inbound.
Stop missing critical business insights.
Glasaly helps you create, share, and track interactive dashboards effortlessly.
- Real-time data visualization
- Collaborative report sharing
- Customizable analytics widgets
No credit card required
1. Lead-time dashboards. Most of them show an average lead time and maybe a rolling standard deviation. That's not enough right now. During volume swings, the distribution shifts — the median might hold while the tail blows out. If your buyers are ordering to a mean lead time of, say, 34 days while the 90th percentile has quietly crept to 51, you're systematically under-buffering your riskiest orders.
2. Days-of-inventory (DOI) by segment. Split it. Aggregate DOI is comforting and useless in this window. You want DOI broken out by lead-time bucket (short domestic vs. long import) and by seasonal flag. A company sitting at 62 days blended might be at 20 days on its back-to-school import SKUs — that's the number that actually matters in August.
3. Fill-rate and its owner. Fill-rate is the metric that gets fuzzy fastest when nobody clearly owns it. Is it order fill? Line fill? Unit fill? During a volatile month those definitions diverge and different teams quote different numbers in the same meeting. Lock the definition and the owner now, before the pullback forces the conversation.
| Dashboard | What most teams show | What to add this month |
|---|---|---|
| Lead time | Average + rolling stdev | Median, 90th percentile, per-lane split |
| Days of inventory | Blended DOI | DOI by lead-time bucket + seasonal flag |
| Fill rate | Single blended % | Locked definition, single owner, order vs. line vs. unit |
| Inbound ETA | Expected receipt date | ETA drift vs. original PO date, flagged |
The ETA drift row deserves specific attention. A lot of teams track expected receipt dates but never track how far those dates have moved from the original commitment. During a soft-import month, drift is your earliest warning — earlier than fill-rate, earlier than DOI. By the time the other metrics move, you've already lost your cheap freight window.
The underlying problem: your analytics assume yesterday's flow rate
Strip away the current event and here's what this really exposes. Replenishment analytics are built on the assumption that recent inbound behavior predicts near-term inbound behavior. That assumption holds fine most of the year. It breaks precisely at inflection points like this one — where a strong trailing month and a softening forward forecast are pointing in opposite directions.
This is fundamentally a spike-and-anomaly detection problem, just inverted. Instead of catching a demand spike, you're catching a supply-side deviation against your planning assumptions. The mechanics are similar: thresholds, contextual diagnostics, and a triage path so the right person looks at the right SKU quickly. If you haven't built that muscle yet, the inventory spike detection workflow with thresholds and contextual diagnostics is the same skeleton you'd adapt here — you're just pointing the detectors at inbound lead-time and ETA drift instead of outbound demand.
One mistake worth flagging: teams tend to build one elaborate scenario model when import forecasts shift, present it once, and move on. That's backwards. What you actually need is fewer, faster, shorter-horizon models you can re-run weekly as the picture updates — not one polished model that's already stale by the time it gets reviewed.
A short-horizon scenario setup you can actually maintain
Keep it deliberately small. Three scenarios, two-to-four week horizon, refreshed weekly. Anything more elaborate won't get re-run, and a stale scenario model is worse than no scenario because people still trust it.
-
Baseline. Current lead times hold, current inbound schedule lands as promised. This is your control.
-
Soft pullback. Import volumes ease as forecast, carrier lead times stretch by roughly 10–20%, and one in every few import POs slips a week. Model the safety-stock top-up and expedited-freight cost to protect your seasonal SKUs.
-
Squeeze. Pullback plus a supplier or two pushing shipments hard, forcing air or expedited ocean on your tightest back-to-school lines. This is the "what does protecting sell-through actually cost us" number.
For each scenario you only need three outputs: projected fill-rate on seasonal SKUs, incremental expedited-shipping spend, and margin impact after that expedited cost. That last one is where most teams get caught off guard — they protect fill-rate and then discover the expedite bill ate the season's margin.
A realistic way this plays out: expediting a container's worth of goods that would've cost a few thousand dollars on standard ocean can run several times that on an accelerated basis. On a seasonal item with thin margins, two or three expedited replenishments can quietly turn a profitable SKU into a break-even one. The scenario model's whole job is to make that visible before the buyer clicks expedite.
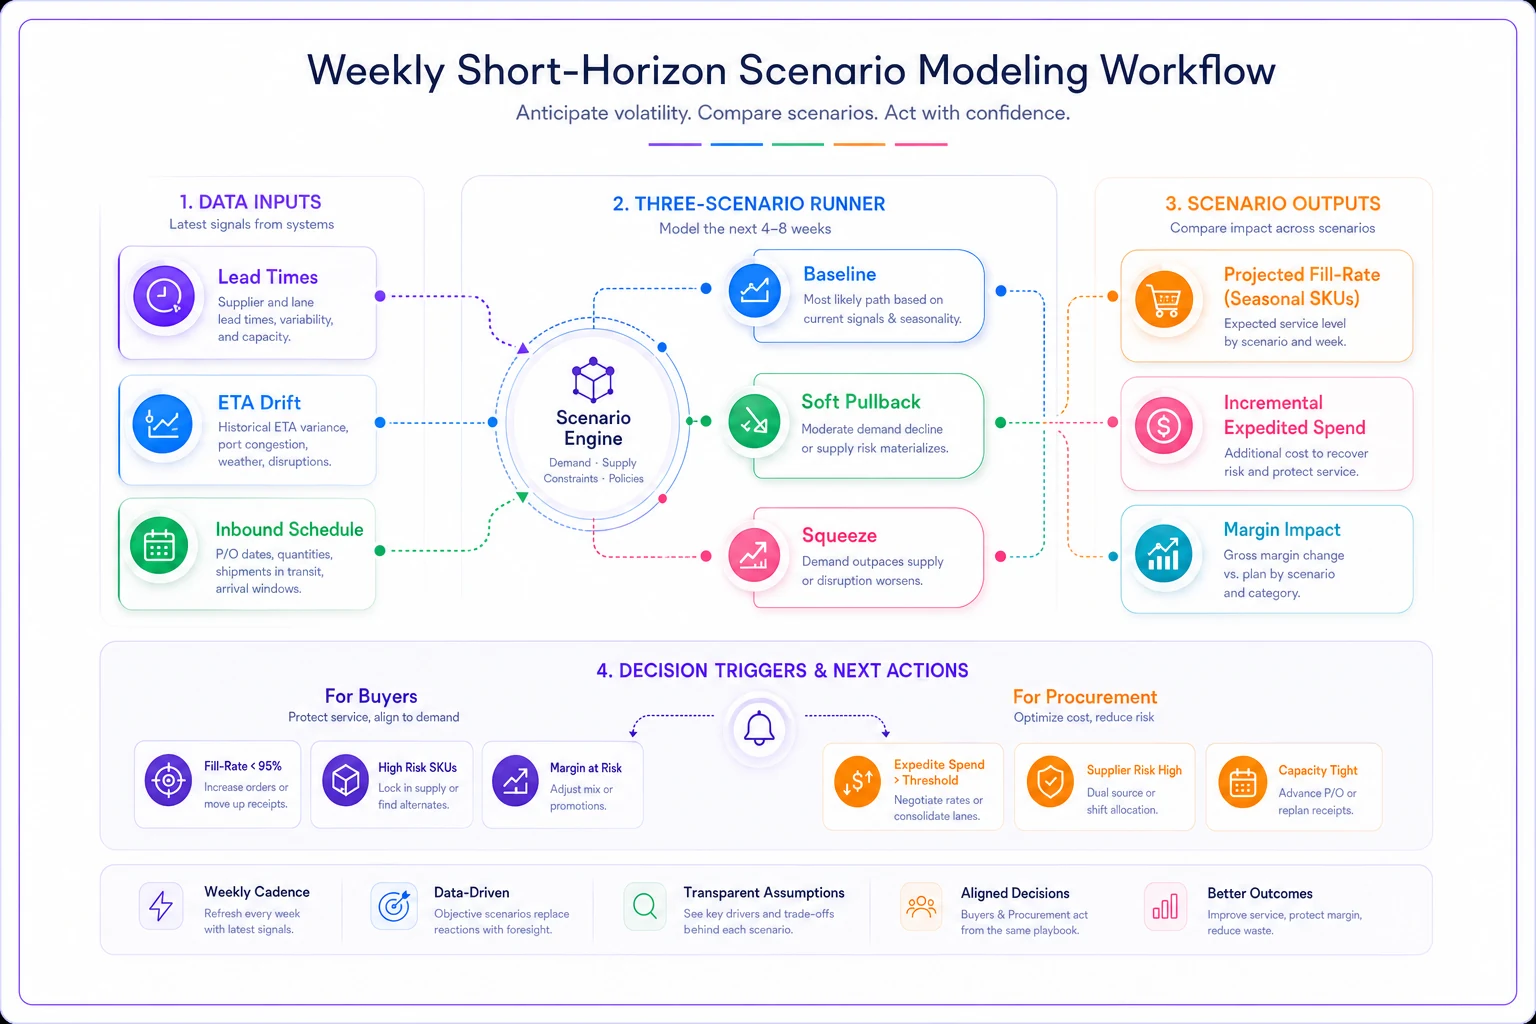
Below is a simple visual of that weekly refresh and decision handoff to keep the model actionable.
The model doesn't need to be elaborate. A simple spreadsheet refreshed weekly beats a complex one nobody touches after the first review.
Real scenario: a mid-size home-goods distributor
A home-goods distributor running roughly 40 import SKUs through a couple of West Coast lanes went into an August much like this one with blended DOI sitting around 58 days. Looked fine. Leadership was relaxed.
The problem was buried in about eight seasonal SKUs feeding back-to-school and early-fall assortments. Those were sitting closer to 22–24 days of inventory on lead times that had quietly stretched from the low-30s into the mid-40s. Nobody caught it because the blended dashboard averaged the seasonal risk against slow-moving evergreen stock with 90-plus days on hand.
When two POs slipped by about ten days each, the distributor had to expedite to hold fill-rate for a key retail account. The expedited freight landed somewhere in the $12k–$16k range across those shipments and clipped the margin on that seasonal line by a meaningful amount.
The fix wasn't complicated. They split DOI by seasonal flag and lead-time bucket, added an ETA-drift flag against original PO dates, and set a simple alert when any seasonal SKU dropped below 30 days and its lane lead time was trending up. The following cycle, the same drift pattern showed up — but three weeks earlier, with the cheap standard-freight window still open. The difference between catching it early and catching it at the dock was most of that expedite bill.
Don't skip the boring part: shipment ETL data quality
During volatile inbound, your shipment and receipt data gets messier — duplicate ASNs, revised ETAs overwriting originals, partial receipts booked against full POs, lane codes miskeyed as carriers reroute. Feed that into a replenishment engine and it will confidently misroute decisions.
-
Preserve original PO commitment dates — never let ETA revisions overwrite the baseline you measure drift against
-
Dedupe ASNs and shipment records on a stable key before they hit the receipt table
-
Reconcile partial receipts so open PO quantities reflect what's actually still inbound
-
Validate lane and carrier codes against a controlled list, especially for rerouted shipments
-
Flag any receipt landing more than a few days off its last ETA for manual review rather than auto-updating downstream
None of this is glamorous. But skip it and every downstream scenario model inherits the garbage. Clean inbound data is the cheapest insurance you'll buy this month.
When to actually intervene — and when to sit still
Not every softening forecast deserves a scramble. Over-reacting to import volatility burns expedite budget and organizational trust just as fast as under-reacting burns sales.
When intervention makes sense: seasonal SKUs with tight sell-through windows, long-lead import lines where you can't re-order inside the season, and any SKU where lane lead time is trending up while DOI is trending down. Those two arrows pointing at each other is your real trigger — not the macro headline.
When to sit still: evergreen SKUs with deep coverage, domestic-sourced items with short lead times, and anything where you've got 90-plus days on hand and re-order flexibility. Expediting those is pure waste. The macro import number is genuinely irrelevant to them this month.
Who should not build the elaborate model: if your inbound ETL isn't clean, don't build the three-scenario setup yet. Fix the data first. A precise scenario model on dirty inbound data gives you false confidence, which is more expensive than the honest uncertainty of no model at all.
What "good" looks like coming out of this month
The teams that handle a month like this well aren't the ones with the fanciest forecast. They're the ones whose dashboards were already segmented by lead-time and seasonality, whose fill-rate had a clear owner, and who tracked ETA drift against original commitments so their warning fired weeks early instead of at the dock.
This isn't about having more data or better tools — it's mostly about what you're choosing to look at. Aggregate metrics are comforting. They're also where seasonal risk goes to hide.
If you take one thing from this: the danger in an August import pullback isn't the pullback itself. It's that your analytics look calm while the risk concentrates in a handful of seasonal, long-lead SKUs that the blended view refuses to surface. Split those out, watch the drift, keep the inbound data clean, and re-run a small scenario model weekly. That's the whole playbook — and most of it is work you can finish before the forecast fully turns.
If you take one thing from this: the danger in an August import pullback isn't the pullback itself. It's that your analytics look calm while the risk concentrates in a handful of seasonal, long-lead SKUs that the blended view refuses to surface. Split those out, watch the drift, keep the inbound data clean, and re-run a small scenario model weekly. That's the whole playbook — and most of it is work you can finish before the forecast fully turns.
Ready to elevate your business intelligence?
Join 2,500+ businesses leveraging Glasaly to drive smarter decisions, improve team alignment, and boost operational performance.