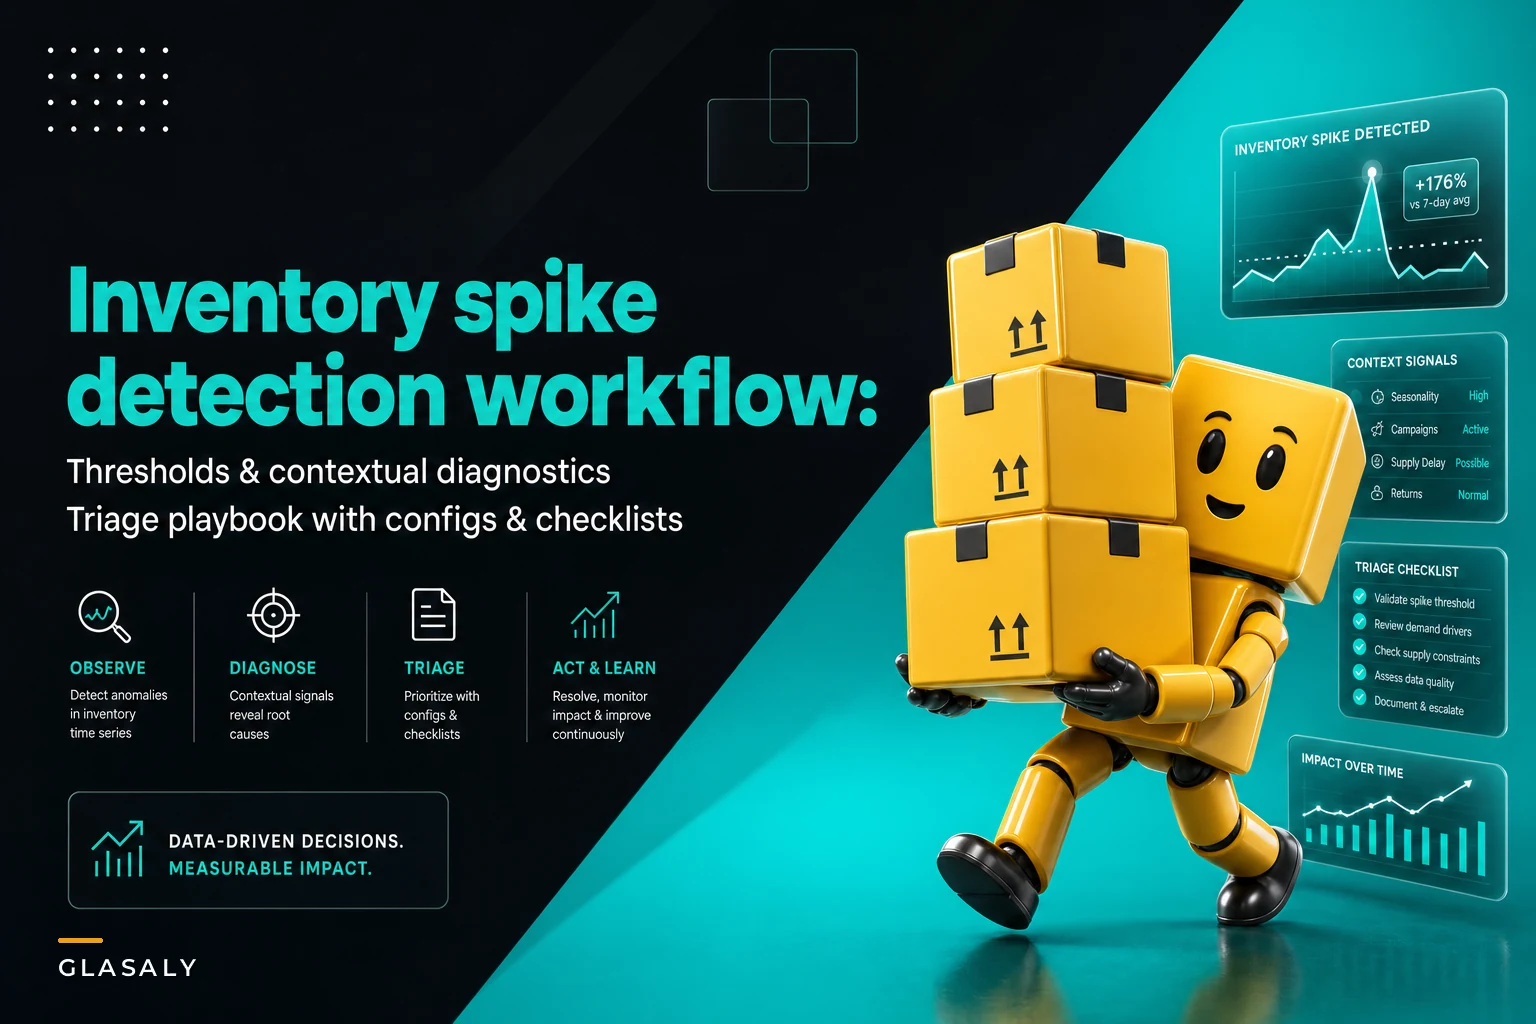

Three weeks ago, an operations manager at a mid-sized electronics distributor got flagged for an inventory spike on USB-C cables. The system showed 400 extra units appearing overnight—technically an anomaly worth investigating. Problem was, this particular SKU costs $3 per unit and normally fluctuates by 200-300 units anyway due to bulk ordering patterns.
The investigation took 6 hours across three departments. Finance pulled transaction logs. Warehouse did a physical count. IT checked for data syncing issues. Total cost of the investigation? Roughly $1,200 in labor hours. The finding? A scheduled bulk delivery that happens every month.
Meanwhile, that same week, a $280 wireless headphone SKU quietly dropped by 30 units—a $8,400 variance—but stayed under the radar because the percentage change looked normal. Those headphones were actually being systematically miscounted during receiving due to a barcode scanning issue that went unnoticed for another two weeks.
This scenario plays out constantly in inventory management. Detection systems flag the wrong things, miss the right things, and nobody has a clear process for figuring out which anomalies actually matter. You end up with analysts drowning in false positives while real problems slip through.
The broken math behind most inventory anomaly detection workflows
Most inventory spike detection starts with someone setting up basic thresholds—usually percentage-based rules that sound reasonable in a meeting but fall apart in practice.
A typical setup might flag anything over 20% variance from the weekly average. Sounds logical until you realize that low-volume SKUs trigger constantly (5 units to 7 units = 40% spike!) while high-value items can lose thousands of dollars without hitting that threshold.
The math gets worse when you factor in seasonality. That 20% threshold might work fine in March but becomes useless in November when normal holiday patterns create 50% swings. So teams add exceptions, then exceptions to the exceptions, until the whole system becomes an unmaintainable mess of rules that nobody fully understands.
SKU-class thresholds partially fix this—you set different rules for different product categories. Maybe 5% variance for high-value electronics, 30% for low-cost accessories. Better, but still misses context. A 30% spike in phone cases might be normal during a new iPhone launch but suspicious in February.
Even when the math works, the workflow usually doesn't. An alert fires, gets sent to someone's email, maybe gets looked at tomorrow, possibly gets investigated next week. By then, if there was a real problem, the damage is done. Shrinkage has occurred, orders have shipped incorrectly, or purchasing decisions were made on bad data.
Building thresholds that actually reflect operational reality
Effective threshold design starts with accepting that different SKUs behave completely differently. A $2,000 laptop and a $5 phone case need entirely separate detection logic.
Stop missing critical business insights.
Glasaly helps you create, share, and track interactive dashboards effortlessly.
- Real-time data visualization
- Collaborative report sharing
- Customizable analytics widgets
No credit card required
Start with value-weighted thresholds. Instead of flagging "20% variance," flag variances that represent actual dollar impact. For that electronics distributor, this meant different rules for different value classes.
For A-class items (top 20% by value), flag any variance over $500 OR 5%, whichever is lower. For B-class items (middle 60%), flag variances over $1,000 OR 15%, whichever is lower. For C-class items (bottom 20%), flag only variances over $2,000 OR 30%, whichever is lower.
This immediately cut false positives by roughly 60%. Those USB-C cables? They're C-class items, so a 400-unit spike ($1,200 value, 25% variance) stays below the threshold. But those wireless headphones dropping 30 units? That's a B-class item with a $8,400 variance—instant flag.
Next layer: contextual modifiers based on SKU behavior patterns. Products with naturally high variability get wider thresholds. The formula becomes: Base Threshold × (1 + Historical Volatility Factor).
If USB-C cables normally swing by 200-300 units, their volatility factor might be 1.5, giving them extra breathing room. Meanwhile, laptop inventory that usually stays within 5 units keeps a tight threshold.
Then add temporal context. Monday mornings after weekend deliveries should expect different patterns than Thursday afternoons. Multiply thresholds by day-of-week and week-of-month factors derived from historical patterns:
| Day | Receiving Pattern | Threshold Modifier |
|---|---|---|
| Monday | Heavy receiving (weekend accumulation) | 1.4x |
| Tuesday | Normal | 1.0x |
| Wednesday | Light receiving | 0.9x |
| Thursday | Normal | 1.0x |
| Friday | Heavy receiving (week-end prep) | 1.3x |
During month-end, increase all thresholds by 20% to account for typical inventory adjustments and cycle counts. During known promotional periods, increase thresholds for affected SKUs by the expected demand lift.
The diagnostic context that turns noise into signal
A spike detection is only as useful as the information that comes with it. Raw alerts like "SKU-88293 increased 25%" waste everyone's time. The detection needs to package relevant context immediately.
When an anomaly triggers, the system should automatically pull transaction context, historical patterns, and operational flags.
Transaction context includes:
-
Last 5 transactions for this SKU
-
Any receiving documents in the past 48 hours
-
Recent adjustments or transfers
-
Purchase orders scheduled for delivery
Historical patterns include:
-
Same day last week/month variance
-
Seasonal patterns for this time period
-
Recent trend direction (was inventory already climbing?)
Operational flags include:
-
Any recent cycle counts for this location
-
System maintenance or integration issues
-
User activity (who touched this SKU recently?)
-
Related SKU movements (did substitutes also spike?)
A furniture retailer implemented this contextual approach and found that 70% of their "anomalies" could be explained automatically. The system would flag a dining table inventory spike, then immediately note: "Matches PO #4429 delivery schedule, similar spike on same date last month, no unusual activity patterns."
The remaining 30% that couldn't be explained automatically? Those were the ones worth investigating. And investigators arrived with context already loaded—they knew which transactions to check, which staff members to talk to, and which related SKUs to examine.
Context packages should look something like this for a legitimate issue:
ANOMALY DETECTED: SKU-7739 (Wireless Mouse) Variance: -45 units ($1,350 value) Class: B-item
TRANSACTION CONTEXT:
-
No receiving in past 72 hours
-
3 sales transactions (total
8 units)
-
1 cycle count 14 days ago (no variance)
-
No scheduled transfers
UNUSUAL PATTERNS:
-
Variance concentrated in Bin A-14
-
Similar drop in related SKU-7740 (Keyboard)
-
Both items share picking path
-
Overnight variance (no transaction record)
HYPOTHESIS: Possible picking error or shrinkage in Zone A
That context immediately pointed the team toward a specific warehouse zone where they found a new employee had been accidentally double-picking items due to a confusing bin labeling system.
The triage playbook that prevents analysis paralysis
Even with good thresholds and rich context, teams still need a clear decision tree for handling anomalies. Otherwise, you get inconsistent responses—one person launches a full investigation for a $500 variance while another ignores a $5,000 problem.
The triage playbook breaks down into three escalation levels.
Level 1: Auto-resolve (No human needed)
-
Variance explained by scheduled PO
-
Variance within normal volatility range after context check
-
Cycle count scheduled within 48 hours anyway
-
Value below minimum threshold (varies by business)
Level 2: Quick verify (15-minute check)
-
Unexplained variance between moderate value thresholds
-
Anomaly in theft-prone SKU
-
Pattern across multiple related SKUs
-
New SKU with limited baseline data
Level 3: Full investigation (1-4 hour deep dive)
-
Unexplained variance over high value threshold
-
Pattern suggesting systematic issue
-
Multiple Level 2 escalations for same SKU/zone
-
External complaint correlating with anomaly
The Level 2 verification checklist keeps things moving efficiently.
Check physical inventory sample (5 minutes):
-
Count 3 bins for this SKU
-
If all 3 match system, likely data issue
-
If physical doesn't match, expand count
Review recent transactions (5 minutes):
-
Look for patterns in user, time, or location
-
Check for manual adjustments
-
Verify receiving documentation matches system
Quick communication check (5 minutes):
-
Message warehouse lead about any known issues
-
Check if any reported problems in area
-
Review any recent process changes
If these checks explain the variance, document and close. If not, escalate to Level 3.
The Level 3 investigation follows a more thorough playbook. Phase 1: Contain (First 30 minutes) involves freezing affected SKU from auto-replenishment, flagging for cycle count at next shift change, documenting all recent system/process changes, and identifying value at risk if issue continues.
Phase 2: Diagnose (Next 2 hours) includes full physical count of affected SKU(s), transaction audit for past 7 days, interviewing staff who handled SKU, reviewing security footage if shrinkage suspected, checking for similar issues at other locations, and testing transaction flow for system bugs.
Phase 3: Resolve (Next 1-2 hours) covers determining root cause, making inventory adjustments with documentation, implementing immediate fix, scheduling follow-up verification, updating detection rules if needed, and documenting lessons learned.
Here's a simple workflow diagram of the triage playbook.
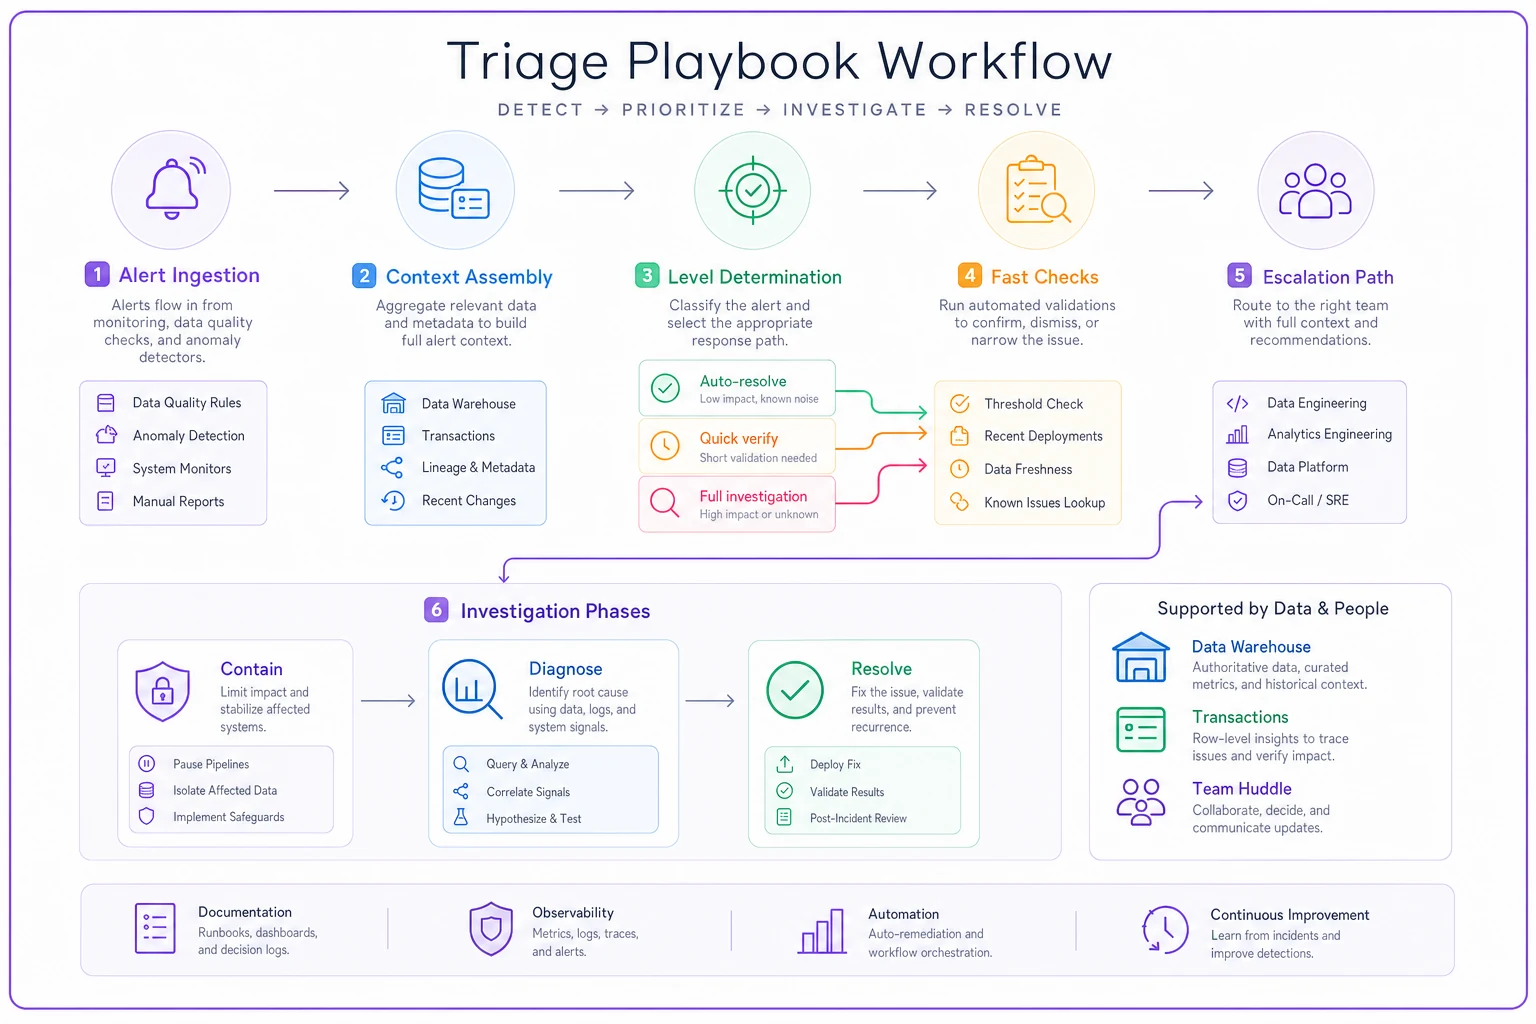
The diagram maps alerts to automated checks, quick human verifications, and full investigations so teams know exactly how to respond.
When automated detection creates more problems than it solves
A specialty food distributor learned this lesson the hard way. They implemented an aggressive anomaly detection system that flagged dozens of items daily. The operations team, overwhelmed by alerts, started ignoring them entirely. When $40,000 worth of premium olive oil disappeared over three weeks, the anomaly alerts were buried in a sea of false positives about flour and sugar fluctuations.
The fix wasn't better algorithms—it was fewer, smarter alerts. They instituted a "detection budget": maximum 5 Level 2 alerts per day, maximum 2 Level 3 alerts per week. The system had to prioritize based on dollar impact, unusualness score, and investigation ROI.
This forced the detection logic to be selective. Instead of flagging every statistical anomaly, it ranked them by dollar value at risk, probability of being real issue (based on context), cost to investigate vs potential recovery, and pattern correlation (multiple small anomalies in same area).
Alert volume dropped 80%, but catch rate for real issues increased from about 20% to 65%. The team actually investigated alerts because they trusted them to be worth their time.
Sample configurations for different operational contexts
High-volume retail (thousands of SKUs, rapid turnover):
A-Class Items (Top 100 SKUs by revenue) use base threshold of $250 or 3%, minimal volatility adjustment (0.8x to 1.2x), 4-hour context window, and auto-escalate to Level 2.
B-Class Items (Next 500 SKUs) use base threshold of $500 or 10%, standard volatility adjustment (0.5x to 2.0x), 24-hour context window, and Level 1 triage unless pattern detected.
C-Class Items (Everything else) use base threshold of $1000 or 25%, wide volatility adjustment (0.3x to 3.0x), 48-hour context window, and Level 1 triage only.
Manufacturing with raw materials:
Raw Materials use 2% or $5000 base threshold, check against production schedule, flag if no production planned in 48 hours, and auto-resolve if matches BOM requirements.
Work-in-Progress uses 5% or $2000 base threshold, must correlate with production reports, flags if variance doesn't match throughput, and escalates if pattern across multiple stages.
Finished Goods use 3% or $3000 base threshold, check against shipping manifests, flag if no orders explain movement, and compare with quality hold reports.
Distribution center with multiple locations:
Cross-dock items (never stored) use threshold of any variance over 0, immediate Level 3 escalation, and check transportation logs.
Regular stock uses location-specific thresholds based on volume, pattern detection across locations, flags transfers that create anomalies at both ends, and weekly rollup of micro-variances by zone.
The human judgment layer that algorithms can't replace
Even the best detection system needs human pattern recognition for certain scenarios. A sudden spike in winter coat returns in March might be normal (end of season), suspicious (quality issue), or criminal (return fraud). The context helps, but human judgment makes the call.
The key is structuring human involvement efficiently. One approach that works: the morning anomaly huddle. Takes 15 minutes, covers overnight flags, makes quick decisions on investigation priorities.
The huddle follows a simple format. Review Level 3 alerts first (should be rare), quick scan of Level 2 patterns, note any concerning trends, assign investigations, and review yesterday's resolved items for patterns.
One distribution center manager described their evolution: "We went from reactive panic—running around counting things whenever someone noticed something odd—to this structured approach. Now we catch problems when they're small. Last month we identified a receiving error pattern that would've cost us $30k if it had continued. Caught it on day two because three related SKUs showed small variances in the same direction."
Building investigation competence across the team
The best detection system in the world fails if your team doesn't know how to investigate properly. Most operations staff aren't trained investigators—they need structure.
Start with investigation templates that guide thinking.
Quick Investigation Template (Level 2):
-
What changed? (variance amount, percentage, dollar value)
-
When did it change? (specific timeframe)
-
Where did it change? (location, bin, zone)
-
Who was involved? (staff on duty, system users)
-
Does it correlate? (other SKUs, known events)
Deep Investigation Template (Level 3) covers:
-
Timeline construction (build exact sequence)
-
Physical evidence review (counts, documents, video)
-
System audit (logs, user activity, integration status)
-
Pattern analysis (historical, peer locations, related items)
-
Root cause hypothesis (specific, testable)
-
Remediation plan (immediate fix, prevention)
Train staff using historical examples. Take real anomalies from the past year, remove the resolution, and have teams work through them. This builds pattern recognition and confidence.
A building supplies company ran monthly "anomaly workshops" where teams reviewed interesting cases. One session revealed that three different locations had been struggling with the same cement bag counting issue—the bags were stacked in a way that made manual counts consistently wrong. Sharing that insight saved hours of future investigations.
The feedback loop that keeps improving detection accuracy
Every investigation, successful or not, should feed back into the detection system. Otherwise you're stuck with the same false positives month after month.
Track these metrics for each anomaly: was it real or false positive, how long to resolve, root cause category, could threshold adjustment prevent recurrence, and what context would have helped.
Monthly review identifies patterns. SKUs that constantly false-positive need threshold adjustment. Real issues that weren't caught need tighter thresholds. Investigation bottlenecks need process improvement. Training gaps need team development.
One medical supplies distributor found that 40% of their false positives came from the same 20 SKUs—items with unusual ordering patterns that didn't fit their standard model. They created a separate "irregular" classification with custom rules, immediately cutting noise by a third.
Technology augmentation without complexity overload
Modern inventory systems can leverage AI automation to dramatically improve anomaly detection and triage workflows. But the key is augmentation, not replacement.
AI agents excel at pattern recognition across huge datasets. They can identify subtle correlations humans miss—like how rain delays at a specific port consistently cause inventory spikes 6 days later at certain distribution centers. This contextual intelligence helps separate real anomalies from predictable variations.
Operational software enhanced with AI automation can handle the entire context-gathering phase. When an anomaly triggers, automated systems immediately pull relevant transactions and documents, identify similar historical patterns, check for correlating anomalies, generate investigation hypotheses, and route to appropriate team member.
This cuts investigation prep time from 30 minutes to basically zero. The human investigator arrives with full context loaded.
But the system shouldn't try to fully automate decision-making. A distribution manager explained their balance: "The AI catches things we'd miss and speeds up the boring parts—pulling reports, checking patterns, doing initial counts. But when it comes to deciding whether to pull inventory from the floor or confronting an employee about potential theft, that's still very much a human call."
The sweet spot combines AI-powered pattern detection with human workflow management. The technology handles data processing, context assembly, and initial triage. Humans make the judgment calls, run the investigations, and own the business decisions.
The right combination of value-weighted thresholds, contextual diagnostics, a clear triage playbook, human judgment, and measured technology augmentation turns noisy anomaly streams into actionable signals that protect value without overwhelming teams.
Ready to elevate your business intelligence?
Join 2,500+ businesses leveraging Glasaly to drive smarter decisions, improve team alignment, and boost operational performance.