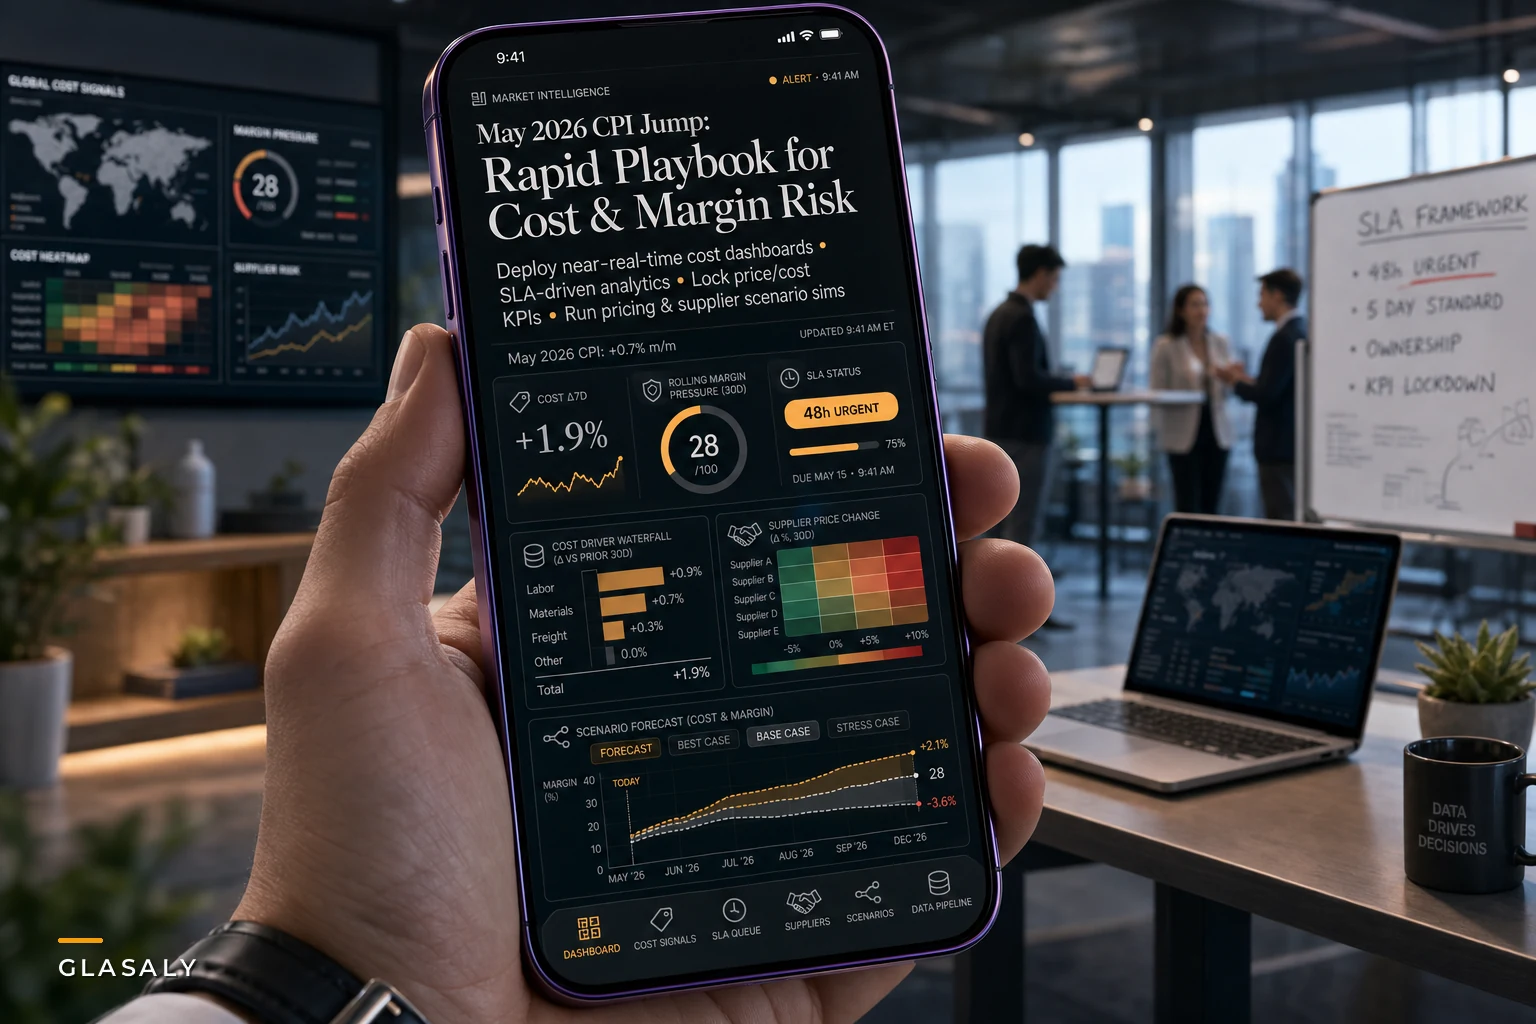

The May CPI numbers just dropped a reality check on every operations team in America. Core inflation jumped to 4.2% year-over-year with a 0.5% monthly rise — the steepest annual gain we've seen since April 2023. That's not just a statistical blip. That's suppliers calling you about price adjustments, freight costs blowing past quarterly projections, and your CFO asking why margin forecasts from two weeks ago are already obsolete.
When inflation spikes like this, your BI team gets flooded with executive requests for "updated dashboards by EOD." Product managers want pricing elasticity models refreshed. Supply chain wants vendor cost tracking at SKU level. Sales needs competitive pricing analysis yesterday. Meanwhile, your standard monthly reporting cadence just became worthless because the underlying cost assumptions shifted mid-cycle.
This isn't about building prettier dashboards. This is about retooling your entire analytics operation to handle volatile cost environments where a two-week delay in spotting margin compression means missing quarterly targets.
The Cascading Analytics Failure Pattern
Every inflation spike triggers the same operational breakdown, and most analytics teams don't see it coming until they're drowning in ad-hoc requests.
It starts innocently enough. The procurement team notices their aluminum supplier just sent a 7% increase notice effective in 30 days. They shoot over a quick Slack message asking if you can "update the COGS projections." Simple request, right? Except that aluminum flows into 47 different SKUs across three product lines, each with different margin profiles and price sensitivities.
Finance jumps in. They need to understand the P&L impact if you can't pass through the full cost increase to customers. But your pricing analytics were built assuming stable input costs, so now you're manually adjusting Excel models that weren't designed for rapid scenario testing.
By day three, you've got seventeen different stakeholders asking for seventeen different cuts of the same underlying data. Marketing wants to know which customer segments can absorb a 3% price increase. Operations needs to identify which products to deprioritize if margins go negative. The CEO wants a single dashboard showing real-time margin health across all business units.
Your team ends up building point solutions for each request. No standardized definitions. No consistent data refresh cycles. No way to reconcile why marketing's margin calculation shows 32% while finance shows 28.4% for the same product line.
Traditional analytics infrastructure breaks here. Not because the tools can't handle it, but because the operating model assumes stable conditions. When inflation accelerates, you need inflation analytics capabilities that most teams haven't built.
Building the Three-Layer Cost Signal Architecture
Teams that maintain visibility don't try to track everything. They build a three-layer monitoring system that balances speed with accuracy.
Stop missing critical business insights.
Glasaly helps you create, share, and track interactive dashboards effortlessly.
- Real-time data visualization
- Collaborative report sharing
- Customizable analytics widgets
No credit card required
Layer 1: Daily Flash Indicators These are your canary-in-the-coal-mine metrics. Not perfect, not comprehensive, but fast. A distribution company tracked just four numbers daily: average freight cost per mile, warehouse labor cost per unit shipped, fuel surcharge percentage, and customer order cancellation rate. Took their analyst 20 minutes each morning to update. When freight costs jumped 12% in a week, they knew immediately.
Layer 2: Weekly Margin Pressure Reports Connect cost changes to actual P&L impact. Pick your top 20% of products by revenue and model their fully-loaded margins weekly. Include materials, labor, overhead allocation, shipping. Yes, it's more work than monthly reporting. But catching margin compression two weeks earlier can save hundreds of thousands in unnecessary inventory purchases or misguided promotional spending.
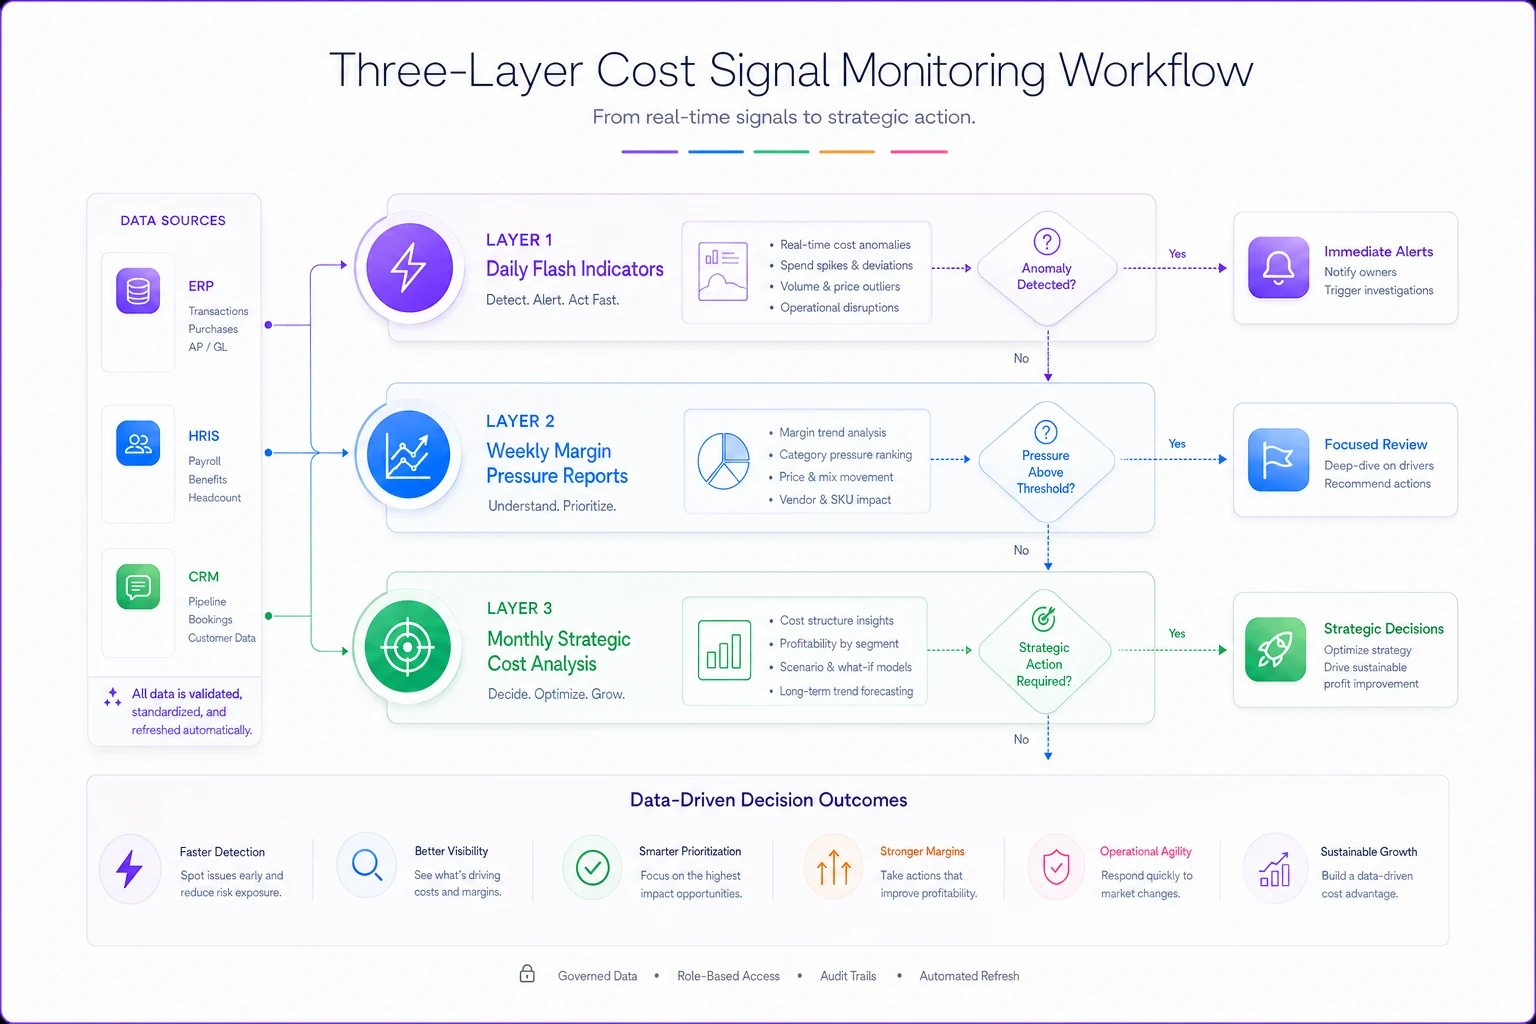
This simple diagram shows how the fast indicators feed into deeper weekly and monthly analysis so teams can act at the right cadence.
Layer 3: Monthly Strategic Analysis Your deep-dive layer. Customer cohort profitability. Supplier concentration risk. Price elasticity testing results. Product mix optimization scenarios. The stuff that takes real analytical work but drives major strategic decisions.
Most teams try to do everything at the monthly layer, which means they're always three weeks behind reality. Or they panic and try to track everything daily, which burns out the team and produces noise instead of signal.
The Vendor Cost Pass-Through Decision Matrix
One of the ugliest meetings in any company happens when procurement, finance, and sales argue about whether to eat cost increases or pass them to customers. Without proper analytics, it becomes a shouting match of opinions.
| Scenario | Customer Concentration | Competitive Position | Historical Elasticity | Decision | Risk Score |
|---|---|---|---|---|---|
| Premium product line | Top 10 customers = 45% revenue | Market leader | 5% price increase → 2% volume drop | Full pass-through | Low |
| Commodity SKUs | Fragmented base | One of many suppliers | 3% increase → 8% volume drop | Absorb temporarily | High |
| Contract-locked items | 3-year agreements with 60% of revenue | Sole source | Cannot change price | Eat the cost | Critical |
| Promotional products | Price-sensitive segments | Competitive disadvantage | 1% increase → 12% volume drop | Selective increases | Medium |
Blanket decisions destroy margin. A manufacturing client tried to pass through a flat 4% increase across all products when steel prices spiked. They lost 22% of their commodity product revenue while leaving money on the table with premium lines that could have absorbed 7-8% increases.
You need customer-level, product-level, and timing-level analytics to make these calls correctly. That means your data infrastructure needs to connect sales, operations, and financial data in near real-time — something most companies claim they have but actually don't when pressure-tested.
Prioritize pass-through analysis for high-revenue and contract-bound customer segments first.
That means your data infrastructure needs to connect sales, operations, and financial data in near real-time — something most companies claim they have but actually don't when pressure-tested.
Real-Time Revenue Concentration Risk Monitoring
Inflation doesn't hit all customers equally, and that concentration risk can kill you.
A food distribution business learned this the hard way. They had roughly 400 active customers, felt nicely diversified. When inflation pushed their costs up 6%, they passed through 4.5% thinking they'd found the sweet spot. Within eight weeks, they lost 70% of their quick-service restaurant customers who operated on razor-thin margins and couldn't absorb the increase. Turned out those QSR customers, while only 15% of customer count, drove 38% of revenue and 45% of margin dollars due to their high-volume, predictable orders.
You need dynamic customer segmentation that updates as market conditions change. Static annual customer tiers are useless when inflation is running hot.
Build a monitoring system that tracks:
-
Revenue concentration by customer margin tolerance (not just size)
-
Customer financial health indicators (payment delays, order frequency changes)
-
Competitive alternatives available to each customer segment
-
Contract expiration timelines overlaid with cost increase projections
Companies create automated alerts when any single customer exceeds 8% of monthly revenue or when customers representing over 20% of margin dollars show signs of stress. This early warning system gives you 30-60 days to adjust strategy before losing critical accounts.
The Scenario Planning Infrastructure Problem
Every inflation spike triggers the same request from executives: "Run scenarios for 2%, 5%, and 8% cost increases." Sounds reasonable until you realize most analytics teams need two weeks to properly model a single scenario.
The problem isn't computational — modern BI tools can crunch these numbers instantly. The problem is data integration and assumption management. Your labor costs sit in the HRIS system. Material costs live in the ERP. Overhead allocations exist in some byzantine Excel model the finance team maintains. Customer price sensitivity data might be in the CRM, or more likely, in the sales VP's head.
A logistics company with 200 employees spent three weeks building their first inflation scenario model. By the time they presented it to the board, input costs had already moved beyond their worst-case assumptions.
Instead of perfect models, build rapid approximation capabilities. Create simplified scenario templates that can give you 80% accuracy in 20% of the time. Having rough scenarios updated daily beats having perfect scenarios updated quarterly.
Maintain a single source of truth for your top 50 cost drivers — not every line item, just the ones that actually move the needle. Pre-build the integration pipes so these update automatically. Establish standard assumptions that can be tweaked quickly (like "labor costs increase at 70% of CPI" or "we can pass through 60% of material cost increases with a 45-day lag").
The teams that navigate inflation successfully aren't the ones with the most sophisticated models. They're the ones that can generate directionally correct scenarios fast enough to actually influence decisions.
Creating the Weekly Margin Variance Heartbeat
Most companies run monthly margin analysis. By the time you spot a problem, analyze root causes, and implement fixes, you've lost 6-8 weeks of margin. In volatile periods, that's the difference between hitting plan and missing by 20%.
The solution isn't daily margin reporting — that creates noise and false alarms. You need a weekly rhythm that's sustainable for your team and actionable for leadership.
Start with a simple variance waterfall. Last week's margin rate versus this week's. Then break down the change:
-
Volume/mix impact
-
Price realization
-
Material cost changes
-
Labor cost changes
-
Overhead absorption
-
Everything else (keep this below 10% of total variance)
A contract manufacturer implemented this after getting burned in a previous inflation cycle. Week one showed a 40 basis point margin drop. Small enough to ignore in a monthly report. But the breakdown showed material costs up 80 basis points, partially offset by favorable mix. By week three, when mix normalized, margins cratered 120 basis points. Because they caught it early, they immediately started customer price negotiations instead of waiting for month-end.
Making this systematic, not heroic, is critical. If generating this report requires your best analyst working all weekend, it won't survive. Build it into your standard data pipelines. Automate the variance calculations. Create exception reporting so you only deep-dive when variances exceed thresholds.
This is where having a proper analytics operating model with clear SLAs becomes critical. When inflation heats up, you can't suddenly ask your analytics team to 5x their output. You need the infrastructure and processes already in place.
The Supply Chain Visibility Gap
Inflation exposes a dirty secret in most analytics operations: nobody actually knows their true supply chain costs until it's too late.
You know what you paid for raw materials last month. You know your freight invoice from last week. But what about the price-lock contract expiring in 60 days? The supplier who just got acquired by a private equity firm known for aggressive price increases? The single-source component that represents 2% of cost but could shut down production if unavailable?
A consumer goods company thought they had supply chain visibility. Beautiful dashboards showing spend by supplier, on-time delivery rates, quality metrics. When inflation hit, they discovered they were actually tracking historical data with no forward-looking indicators. Their aluminum supplier had been warning about price increases in quarterly business reviews for six months, but that information lived in meeting notes, not dashboards.
Real supply chain intelligence for inflation analytics requires three components most companies lack:
Component 1: Contract visibility Not just when contracts expire, but what pricing mechanisms they contain. Fixed price? Indexed to commodities? Market-based adjustment clauses? Without this, you're flying blind into renewal negotiations.
Component 2: Supplier financial health monitoring Your supplier's cost structure matters as much as yours. If their margins are getting squeezed, price increases are coming whether they've announced them or not. Track their public financials if available. Monitor industry reports. Set up Google alerts for major suppliers.
Component 3: Alternative supplier modeling For every critical input, know what it would cost to switch suppliers. Include not just unit price but switching costs, quality risks, and timeline. When your primary supplier announces a 15% increase, you need to know immediately if that's above or below market.
Customer Behavior Pattern Recognition
Reuters reported that companies are seeing rapid shifts in consumer price sensitivity as inflation expectations reset. But aggregate data hides what's really happening at the customer level.
When costs rise, customers don't uniformly reduce spending. They shift behaviors in predictable but non-obvious ways. The analytics challenge is spotting these patterns before they show up in revenue reports.
A B2B software company with 3,000 customers noticed something odd when they raised prices 8% to offset increased labor costs. Enterprise customers barely flinched — renewal rates stayed at 94%. Mid-market customers negotiated harder but ultimately renewed at 87%. But small businesses didn't fight the increase at all. They just quietly didn't renew. SMB churn hit 28%, up from the normal 15%.
The pattern makes sense in hindsight. Enterprise customers have procurement departments that negotiate everything. Mid-market companies have enough scale to push back but ultimately need the software. Small businesses just silently look for alternatives because they don't have time to negotiate.
Your inflation analytics need behavioral early warning signals:
-
Quote-to-close rates by segment
-
Sales cycle length changes
-
Support ticket volume about pricing
-
Feature usage patterns (customers exploring cheaper tiers)
-
Payment timing changes (stretching payment terms)
These aren't traditional financial metrics. They're operational indicators that presage financial impact. The companies that maintain margin through inflation cycles spot customer stress signals early enough to adjust.
The Organizational Analytics Bottleneck
When inflation spikes, every department suddenly becomes a data team. Sales builds their own pricing models. Marketing creates customer segmentation analyses. Operations develops cost tracking spreadsheets. Finance maintains the "official" margin calculations. None of these reconcile.
A retail chain with 180 locations discovered they had fourteen different definitions of "margin" floating around the organization. Product margin, transaction margin, customer margin, store margin, channel margin — all calculated differently, all supposedly correct, all telling different stories about business performance.
The chaos intensifies during inflation because everyone needs answers immediately. There's no time for the normal governance processes. Analytics requests bypass standard channels. Shadow IT explodes. Excel models multiply. Leadership meetings become arguments about whose numbers are right instead of discussions about what to do.
Some companies thrive during volatile periods while others scramble. The successful ones have already built analytical infrastructure that can flex without breaking. They've established clear data ownership. They've automated core calculations. They've created self-service capabilities so stakeholders can answer their own questions without creating analytics bottlenecks.
It's not about having more analysts or better tools. It's about having an operating system for analytics that scales with demand.
Building Your 30-Day Inflation Response Plan
Days 1-5: Triage and Stabilization Stop trying to fix everything. Pick three KPIs that actually matter for immediate decisions. Usually some version of: gross margin by product line, customer concentration risk, and days of inventory at current burn rate. Get these updating daily, even if it's manual.
Days 6-10: Cost Driver Identification Map your top 10 cost drivers to their source systems. Not every cost — just the ones that represent 80% of your spend. Create simple tracking for these. An industrial equipment distributor found that tracking just steel, freight, and warehouse labor covered 73% of their cost structure. The other 200+ line items could be managed by exception.
Days 11-20: Scenario Engine Build Don't build the perfect model. Build a functional approximation that can run scenarios in hours, not weeks. Hard-code assumptions if you need to. Use rules of thumb instead of precise calculations. A 85% accurate model you can update daily beats a 99% accurate model that takes two weeks to refresh.
Days 21-30: Organizational Enablement Create simple decision templates. Train key stakeholders on the new dashboards. Establish meeting rhythms to review the data. Set up automated alerts for threshold breaches.
A building materials distributor executed this playbook when lumber prices spiked 40% in six weeks. Instead of panicking, they methodically built visibility, then control, then prediction capabilities. By day 30, they were running daily scenario models and adjusting prices by geography and customer segment while competitors were still trying to understand their exposure.
The Next Inflation Spike Is Coming
The May CPI data is just one data point in what's likely to be a volatile period. Whether it's supply chain disruptions, labor shortages, or geopolitical tensions, the forces that drive sudden cost increases aren't going away.
The companies that maintain margins through these cycles aren't necessarily the ones with the most sophisticated analytics platforms. They're the ones that have built operational rhythms and organizational capabilities to sense, interpret, and respond to cost changes faster than their competitors.
This means your inflation analytics infrastructure isn't just about dashboards and data pipelines. It's about creating an operational nervous system that can detect weak signals, process complex changes, and coordinate responses across departments. Some organizations build this organically through painful trial and error. Others implement AI-powered operational software that centralizes these capabilities and automates the heavy lifting of data integration and scenario modeling.
The question isn't whether you'll face another inflation spike. It's whether your analytics operation will be ready when it arrives. Most companies won't be. They'll scramble, react late, and watch margins erode while wondering why their beautiful dashboards didn't prevent the crisis.
But for organizations that build proper inflation analytics capabilities — the ones who can spot margin pressure early, model scenarios rapidly, and coordinate responses effectively — these volatile periods become opportunities to gain competitive advantage while others struggle to understand what hit them.
The May CPI numbers are a reminder: analytics must be an operational capability, not just a reporting function. Build the right layers, instrument the right signals, and make sure your organization can act on what the data says.
Ready to elevate your business intelligence?
Join 2,500+ businesses leveraging Glasaly to drive smarter decisions, improve team alignment, and boost operational performance.